Yann Neuhaus
Learning Azure by having fun with ChatGPT
Are you studying for an Azure certification? You may feel at some point you need a break from the dry and factual technical information. I’m in your shoes right now and I have done some experiments with ChatGPT. I’m not using it to write my text but to learn by having fun! It is very good at telling stories so why not use that for what interests me right now? Azure architecture!
In this blog post I’m going to show you how I use it, it may give you some ideas to make your learning a little more spicy!
 Prompt for preparing ChatGPT with Azure
First you’ll need to prepare ChatGPT by explaining what you want. Set the framework and limit its responses otherwise it is too chatty. As I like science fiction (sci-fi), I’m interested in a futuristic story but you could choose any style you like. My first prompt and ChatGPT response is shown below:
Act as an Azure architect. You are in charge of educating me, your student, to become an Azure architect too. You will respond to my questions by using story telling to explain each concepts requested.
I want you to:
– Always tell a simple and futuristic story
– Limit the reply to 100 words
As an Azure architect, imagine Azure as a vast cosmic city. Each service is a towering skyscraper, and we, architects, design the blueprints. Let’s start with Virtual Networks. They’re like the city’s infrastructure, connecting buildings. Subnets divide areas within each building, like floors. Next, VMs are the inhabitants, residing in these skyscrapers, each serving a unique purpose. Azure Storage, a network of secure vaults, safeguards their belongings. With Azure Load Balancer as traffic controllers, the city thrives, ensuring smooth navigation. As architects of this digital metropolis, we sculpt a future where innovation soars amidst the azure skyline.
Not bad! It gives me some key components of an Azure infrastructure and makes some analogies I can easily picture in my head. With this basis, I can now be the hero of this story by asking more questions.
Build up that Azure cosmic city with ChatGPTYou can then ask questions around your area of study (mine is Azure architecture) and stay immersed into that story. For example:
What are the best practice to govern this Azure cosmic city?
In our cosmic city, governance is paramount. Azure Policy acts as the city’s constitution, ensuring compliance with regulations. Role-Based Access Control (RBAC) assigns roles to citizens, granting appropriate permissions. Azure Resource Manager templates are like city blueprints, ensuring consistency in construction. Tags label buildings for easy identification, while Azure Monitor keeps a watchful eye on city activities. With these best practices, our cosmic city thrives, ensuring order, security, and harmony amidst the azure skyline.It gives you the key elements of Azure governance by continuing its story. You can go on like this back and forth by throwing in any chapter of your course. You can focus on a specific use case as well and see how it integrates with this story:
How can I migrate my SQL Server database on-premises to this city?
Imagine your SQL Server database as a cozy cottage in the countryside. To migrate to our cosmic city, Azure, we’ll use Azure Database Migration Service, like a futuristic moving company. It carefully transports your data to Azure SQL Database, a sleek skyscraper in our city. With minimal downtime, your database seamlessly transitions to its new home, ready to thrive amidst the azure skyline. Just sit back, relax, and watch as your data becomes part of the bustling digital metropolis.How do I ensure my database is highly resilient in this cosmic city?
In our cosmic city, resilience is key. Azure offers a robust solution: Azure SQL Database with built-in redundancy, akin to a fortress with multiple layers of defense. Automatic backups act as a safety net, ensuring data is never lost. Geo-replication creates duplicates across regions, safeguarding against disasters. With Azure SQL Database’s high availability and disaster recovery features, your database thrives amidst the azure skyline, resilient against any digital storm.I don’t know if it works for you but I find it fascinating I can make ChatGPT talk endlessly and respond to any questions I have about Azure in a sci-fi story!
Dive into an Azure componentAs usual with ChatGPT you need to drive the discussion to get the most of it. Let’s see what it has to say about Azure AD (I use the legacy terminology as ChatGPT v3.5 doesn’t know yet Microsoft Entra ID):
What and where would be the Azure AD in this city?
In our bustling city, Azure AD is the central hub, akin to City Hall. It’s where identities are registered, like citizens in our digital society. Located at the heart of the city, Azure AD ensures secure access to every digital service and resource, much like City Hall grants access to essential services. From authentication to authorization, Azure AD governs the city’s digital identities, ensuring a seamless and secure experience for all inhabitants amidst the azure skyline.How would Azure AD conditional access be implemented in this city?
In our city, Azure AD Conditional Access acts as the city’s security checkpoints. Picture futuristic gates at key entry points, only granting access to authorized individuals based on specific conditions. Want to enter the financial district skyscraper? You’ll need more than just a pass; perhaps a biometric scan during business hours. Conditional Access ensures only the right people, with the right permissions, access sensitive areas of our digital city. It’s our shield against cyber threats amidst the azure skyline, ensuring a safe and secure digital environment for all inhabitants.How would I connect from my Active Directory in the countryside to this Azure AD in the cloud?
In the countryside, your Active Directory (AD) is like a quaint village square, bustling with local identities. To connect to Azure AD in our cosmic cloud city, envision a digital bridge spanning the distance between village and skyline. Azure AD Connect is your trusty guide, seamlessly synchronizing identities from countryside AD to Azure AD. With this bridge in place, villagers can access digital services in the cloud using their familiar countryside credentials. Just like that, the countryside becomes an integral part of our digital metropolis, united under the azure skyline.You can then piece by piece for each component create a complete city in the countryside (OnPrem) and in the cloud and illustrate their interaction. We could completely gamify this! SimCity anyone?
LimitationsSome general concepts are more difficult to put into a visual story as for example the Microsoft Cloud Adoption Framework:
What would be the Microsoft Cloud Adoption Framework for Azure in this city?
In our dynamic metropolis, the Microsoft Cloud Adoption Framework for Azure is our roadmap to success. Like a futuristic GPS, it guides us through the twists and turns of digital transformation. Envisioning helps us set our destination, planning ensures we choose the best route, and readiness prepares us for the journey ahead. Migration helps us seamlessly transition, while innovation propels us forward. With governance as our compass and optimization as our fuel, we navigate the ever-changing landscape, building a future where our digital city thrives amidst the azure skyline. Ready to embark on this transformative journey?I don’t find it fantastic as we recognize the empty blabbering of ChatGPT. We would need to be more specific to get something more interesting.
Wrap upYou can see how by relaxing from your studies, you can still continue to learn by having fun in an imaginary world. You could totally convert all this into visual notes that will help you when you renew your certifications. That is something I’m starting to explore.
This is just a glimpse of how you could use ChatGPT in your journey to learn Azure or anything else. Brainstorm any concept, service or component you are learning and see how it integrates into a visual story to get a high-level picture. Let me know if your are using ChatGPT that way for learning and what is the world you are building for it!
L’article Learning Azure by having fun with ChatGPT est apparu en premier sur dbi Blog.
Monitor Elasticsearch Cluster with Zabbix
Setting up Zabbix monitoring over an Elasticsearch cluster is quiet easy as it does not require an agent install. As a matter a fact, the official template uses the Elastic REST API. Zabbix server itself will trigger these requests.
In this blog post, I will quick explain how to setup Elasticsearch cluster, then how easy the Zabbix setup is and list possible issues you might encounter.
Elastic Cluster SetupI will not go too much in detail as David covered already many topics around ELK. Anyway, would you need any help to install, tune or monitor your ELK cluster fell free to contact us.
My 3 virtual machines are provisioned with YaK on OCI. Then, I install the rpm on all 3 nodes.
After starting first node service, I am generating an enrollment token with this command:
/usr/share/elasticsearch/bin/elasticsearch-create-enrollment-token -node
This return a long string which I will need to pass on node 2 and 3 of the cluster (before starting anything):
/usr/share/elasticsearch/bin/elasticsearch-reconfigure-node --enrollment-token <...>
Output will look like that:
This node will be reconfigured to join an existing cluster, using the enrollment token that you provided.
This operation will overwrite the existing configuration. Specifically:
  - Security auto configuration will be removed from elasticsearch.yml
  - The [certs] config directory will be removed
  - Security auto configuration related secure settings will be removed from the elasticsearch.keystore
Do you want to continue with the reconfiguration process [y/N]
After confirming with a y, we are almost ready to start. First, we must update ES configuration file (ie. /etc/elasticsearch/elasticsearch.yml).
- Add IP of first node (only for first boot strapped) in
cluster.initial_master_nodes: ["10.0.0.x"] - Set listening IP of the inter-node trafic (to do on node 1 as well):
transport.host: 0.0.0.0 - Set list of master eligible nodes:
discovery.seed_hosts: ["10.0.0.x:9300"]
Now, we are ready to start node 2 and 3.
Let’s check the health of our cluster:
curl -s https://localhost:9200/_cluster/health -k -u elastic:password | jq
If you forgot elastic password, you can reset it with this command:
/usr/share/elasticsearch/bin/elasticsearch-reset-password -u elastic
With latest Elasticsearch release, security has drastically increased as SSL communication became the standard. Nevertheless, default MACROS values of the template did not. Thus, we have to customize the followings:
- {$ELASTICSEARCH.USERNAME} to elastic
- {$ELASTICSEARCH.PASSWORD} to its password
- {$ELASTICSEARCH.SCHEME} to https
If SELinux is enabled on your Zabbix server, you will need to allow zabbix_server process to send network request. Following command achieves this:
setsebool zabbix_can_network 1
Next, we can create a host in Zabbix UI like that:
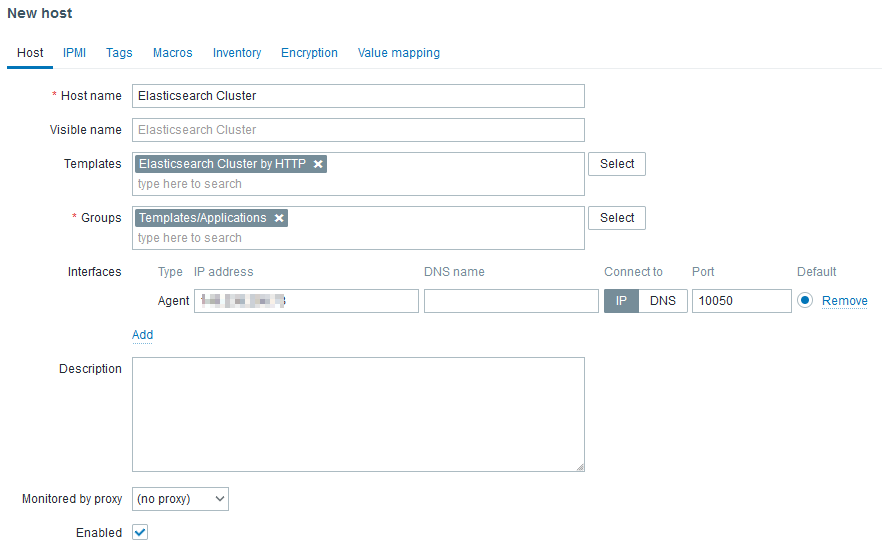
The Agent interface is required but will not be used to reach any agent as there are not agent based (passive or active) checks in the linked template. However, http checks uses HOST.CONN MACRO in the URLs. Ideally, the IP should be a virtual IP or a load balanced IP.
Don’t forget to set the MACROS:

After few minutes, and once nodes discovery ran, you should see something like that:
What will happen if one node stops? On Problems tab of Zabbix UI:

After few seconds, I noticed that ES: Health is YELLOW gets resolved on its own. Why? Because shards are re-balanced across running servers.
I confirm this by graphing Number of unassigned shards:
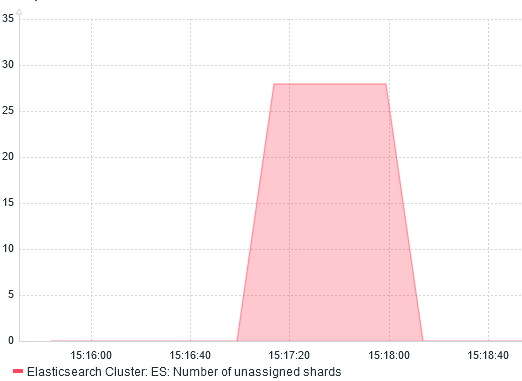
We can also see the re-balancing with the network traffic monitoring:
 Received bytes on the left. Sent on the right.
Around 15:24, I stopped node 3 and shards were redistributed from node 1 and 2.
When node 3 start, at 15:56, we can see node 1 and 2 (20 Mbps each) send back shards to node 3 (40 Mbps received).
ConclusionWhatever the monitoring tool you are using, it always help to understand what is happening behind the scene.
L’article Monitor Elasticsearch Cluster with Zabbix est apparu en premier sur dbi Blog.
Power BI Report Server: unable to publish a PBIX report
I installed a complete new Power BI Report Server. The server had several network interfaces to be part of several subdomains. In order to access the Power BI Report Server web portal from the different subdomains I defined 3 different HTTPS URL’s in the configuration file and a certificate binding. I used as well a specific active directory service account to start the service. I restarted my Power BI Report Server service checking that the URL reservations were done correctly. I knew that in the past this part could be a source of problems.
Everything seemed to be OK. I tested the accessibility to the Power BI Report Server web portal from the different sub-nets clients and everything was fine.
The next test was the upload of a Power BI report to the web portal. Of course I was sure, having a reports developed with Power BI Desktop RS.
Error raisedAn error was raised when uploading a Power BI report in the web portal.

Trying to publish the report from Power BI Desktop RS was failing as well.
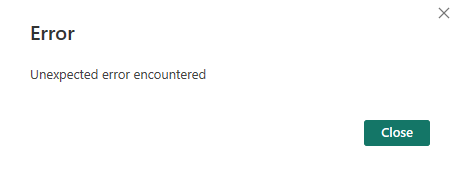 Troubleshouting
Report Server log analysis:
I started to analyze the Power BI Report Server logs. For a standard installation they are located in
C:\Program Files\Microsoft Power BI Report Server\PBIRS\LogFiles
In the last RSPowerBI_yyyy_mm_dd_hh_mi_ss.log file written I could find the following error:
Could not start PBIXSystem.Reflection.TargetInvocationException: Exception has been thrown by the target of an invocation. ---> System.Net.HttpListenerException: Access is denied
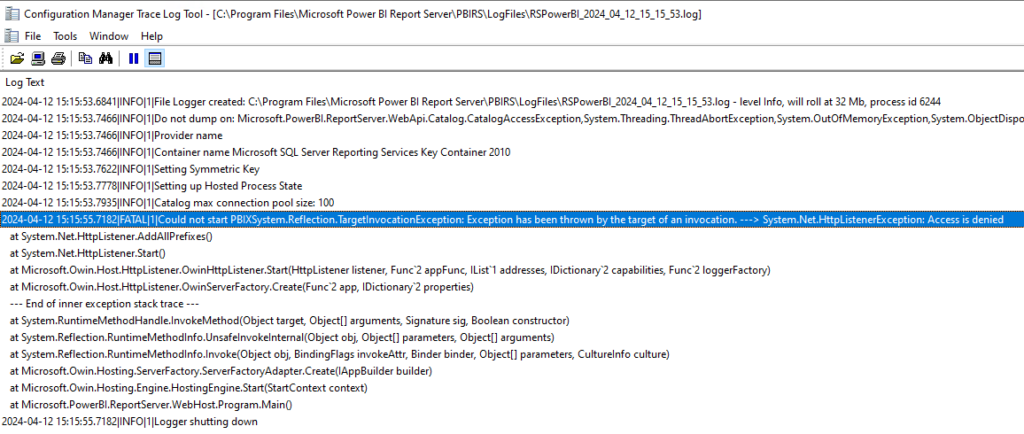
The error showing an Access denied, the first reaction was to put the service account I used to start the Power BI Report Server in the local Administrators group.
I restarted the service and tried again the publishing of the Power BI report. It worked without issue.
Well, I had a solution, but the it wasn’t an acceptable one. A application service account should not be local admin of a server, it would be a security breach and is not permitted by the security governance.
Based on the information contained in the error message, I could find that is was related to URL reservation, but from the configuration steps, I could not notice any issues.
I analyzed than the list of the reserved URL on the server. Run the following command with elevated permissions to get the list of URL reservation on the server:
Netsh http show urlacl
List of URL reservation found for the user NT SERVICE\PowerBIReportServer:
    Reserved URL            : http://+:8083/
        User: NT SERVICE\PowerBIReportServer
            Listen: Yes
            Delegate: No
            SDDL: D:(A;;GX;;;S-1-5-80-1730998386-2757299892-37364343-1607169425-3512908663)

    Reserved URL            : https://sub1.domain.com:443/ReportServerPBIRS/
        User: NT SERVICE\PowerBIReportServer
            Listen: Yes
            Delegate: No
            SDDL: D:(A;;GX;;;S-1-5-80-1730998386-2757299892-37364343-1607169425-3512908663)

    Reserved URL            : https://sub2.domain.com:443/ReportServerPBIRS/
        User: NT SERVICE\PowerBIReportServer
            Listen: Yes
            Delegate: No
            SDDL: D:(A;;GX;;;S-1-5-80-1730998386-2757299892-37364343-1607169425-3512908663)

    Reserved URL            : https://servername.domain.com.ch:443/PowerBI/
        User: NT SERVICE\PowerBIReportServer
            Listen: Yes
            Delegate: No
            SDDL: D:(A;;GX;;;S-1-5-80-1730998386-2757299892-37364343-1607169425-3512908663)

    Reserved URL            : https://servername.domain.com.ch:443/wopi/
        User: NT SERVICE\PowerBIReportServer
            Listen: Yes
            Delegate: No
            SDDL: D:(A;;GX;;;S-1-5-80-1730998386-2757299892-37364343-1607169425-3512908663)

    Reserved URL            : https://sub1.domain.com:443/ReportsPBIRS/
        User: NT SERVICE\PowerBIReportServer
            Listen: Yes
            Delegate: No
            SDDL: D:(A;;GX;;;S-1-5-80-1730998386-2757299892-37364343-1607169425-3512908663)

    Reserved URL            : https://sub2.domain.com:443/ReportsPBIRS/
        User: NT SERVICE\PowerBIReportServer
            Listen: Yes
            Delegate: No
            SDDL: D:(A;;GX;;;S-1-5-80-1730998386-2757299892-37364343-1607169425-3512908663)

    Reserved URL            : https://servername.domain.com.ch:443/ReportsPBIRS/
        User: NT SERVICE\PowerBIReportServer
            Listen: Yes
            Delegate: No
            SDDL: D:(A;;GX;;;S-1-5-80-1730998386-2757299892-37364343-1607169425-3512908663)
Checking the list I could find:
- the 3 URL’s reserved fro the web service containing the virtual directory I defined ReportServerPBIRS
- the 3 URL’s reserved fro the web portal containing the virtual directory I defined ReportsPBIRS
But I noticed that only 1 URL was reserved for the virtual directories PowerBI and wopi containing the servername.
The 2 others with the subdomains were missing.
SolutionI decided to reserve the URL for PowerBI and wopi virtual directory on the 2 subdomains running the following command with elevated permissions.
Be sure that the SDDL ID used is the one you find in the rsreportserver.config file.
netsh http add urlacl URL=sub1.domain.com:443/PowerBI/ user="NT SERVICE\SQLServerReportingServices" SDDL="D:(A;;GX;;;S-1-5-80-1730998386-2757299892-37364343-1607169425-3512908663)"
netsh http add urlacl URL=sub2.domain.com:443/PowerBI/ user="NT SERVICE\SQLServerReportingServices" SDDL="D:(A;;GX;;;S-1-5-80-1730998386-2757299892-37364343-1607169425-3512908663)"
netsh http add urlacl URL=sub1.domain.com:443/wopi/ user="NT SERVICE\SQLServerReportingServices" SDDL="D:(A;;GX;;;S-1-5-80-1730998386-2757299892-37364343-1607169425-3512908663)"
netsh http add urlacl URL=sub2.domain.com:443/wopi// user="NT SERVICE\SQLServerReportingServices" SDDL="D:(A;;GX;;;S-1-5-80-1730998386-2757299892-37364343-1607169425-3512908663)"
Restart the Power BI Report Server service
You can notice that the error in the latest RSPowerBI_yyyy_mm_dd_hh_mi_ss.log file desappeared.
I tested the publishing of a Power BI report again, and it worked.
I hope that this reading has helped to solve your problem.
L’article Power BI Report Server: unable to publish a PBIX report est apparu en premier sur dbi Blog.
PostgreSQL 17: pg_buffercache_evict()
In PostgreSQL up to version 16, there is no way to evict the buffer cache except by restarting the instance. In Oracle you can do that since ages with “alter system flush buffer cache“, but not in PostgreSQL. This will change when PostgreSQL 17 will be released later this year. Of course, flushing the buffer cache is nothing you’d usually like to do in production, but this can be very handy for educational or debugging purposes. This is also the reason why this is intended to be a developer feature.
For getting access to the pg_buffercache_evict function you need to install the pg_buffercache extension as the function is designed to work over the pg_buffercache view:
postgres=# select version();
                              version
-------------------------------------------------------------------
 PostgreSQL 17devel on x86_64-linux, compiled by gcc-7.5.0, 64-bit
(1 row)

postgres=# create extension pg_buffercache;
CREATE EXTENSION
postgres=# \dx
                      List of installed extensions
      Name      | Version |   Schema   |           Description
----------------+---------+------------+---------------------------------
 pg_buffercache | 1.5     | public     | examine the shared buffer cache
 plpgsql        | 1.0     | pg_catalog | PL/pgSQL procedural language
(2 rows)
postgres=# \d pg_buffercache
                 View "public.pg_buffercache"
      Column      |   Type   | Collation | Nullable | Default
------------------+----------+-----------+----------+---------
 bufferid         | integer  |           |          |
 relfilenode      | oid      |           |          |
 reltablespace    | oid      |           |          |
 reldatabase      | oid      |           |          |
 relforknumber    | smallint |           |          |
 relblocknumber   | bigint   |           |          |
 isdirty          | boolean  |           |          |
 usagecount       | smallint |           |          |
 pinning_backends | integer  |           |          |
Once the extension is in place, the function is there as well:
postgres=# \dfS *evict*
                               List of functions
 Schema |         Name         | Result data type | Argument data types | Type
--------+----------------------+------------------+---------------------+------
 public | pg_buffercache_evict | boolean          | integer             | func
(1 row)
To load something into the buffer cache we’ll make use of the pre_warm extension and completely load the table we’ll create afterwards:
postgres=# create extension pg_prewarm;
CREATE EXTENSION
postgres=# create table t ( a int, b text );
CREATE TABLE
postgres=# insert into t select i, i::text from generate_series(1,10000) i;
INSERT 0 10000
postgres=# select pg_prewarm ( 't', 'buffer', 'main', null, null );
 pg_prewarm
------------
         54
(1 row)
postgres=# select pg_relation_filepath('t');
 pg_relation_filepath
----------------------
 base/5/16401
(1 row)
postgres=# select count(*) from pg_buffercache where relfilenode = 16401;
 count
-------
    58
(1 row)
If you wonder why there are 58 blocks cached in the buffer cache but we only loaded 54, this is because of the visibility and free space map:
postgres=# select relforknumber from pg_buffercache where relfilenode = 16401 and relforknumber != 0;
 relforknumber
---------------
             1
             1
             1
             2
(4 rows)
Using the new pg_buffercache_evict() function we are now able to completely evict the buffers of that table from the cache, which results in exactly 58 blocks to be evicted:
postgres=# select pg_buffercache_evict(bufferid) from pg_buffercache where relfilenode = 16401;
 pg_buffercache_evict
----------------------
 t
 t
 t
 t
 t
 t
 t
 t
 t
 t
 t
 t
 t
 t
 t
 t
 t
 t
 t
 t
 t
 t
 t
 t
 t
 t
 t
 t
 t
 t
 t
 t
 t
 t
 t
 t
 t
 t
 t
 t
 t
 t
 t
 t
 t
 t
 t
 t
 t
 t
 t
 t
 t
 t
 t
 t
 t
 t
(58 rows)
Cross-checking this confirms, that all the blocks are gone:
postgres=# select count(*) from pg_buffercache where relfilenode = 16401;
 count
-------
     0
(1 row)
Nice, thanks to all involved.
L’article PostgreSQL 17: pg_buffercache_evict() est apparu en premier sur dbi Blog.
Apache httpd Tuning and Monitoring with Zabbix
There is no tuning possible without a proper monitoring in place to measure the impact of any changes. Thus, before trying to tune an Apache httpd server, I will explain how to monitor it with Zabbix.
Setup Zabbix MonitoringApache httpd template provided by Zabbix uses mod_status which provides metrics about load, processes and connections.
Before enabling this module, we must ensure it is present. httpd -M 2>/dev/null | grep status_module command will tell you so. Next, we can extend configuration by creating a file in /etc/httpd/conf.d:
<Location "/server-status">
  SetHandler server-status
</Location>
After a configuration reload, we should be able to access the URL http://<IP>/server-status?auto.
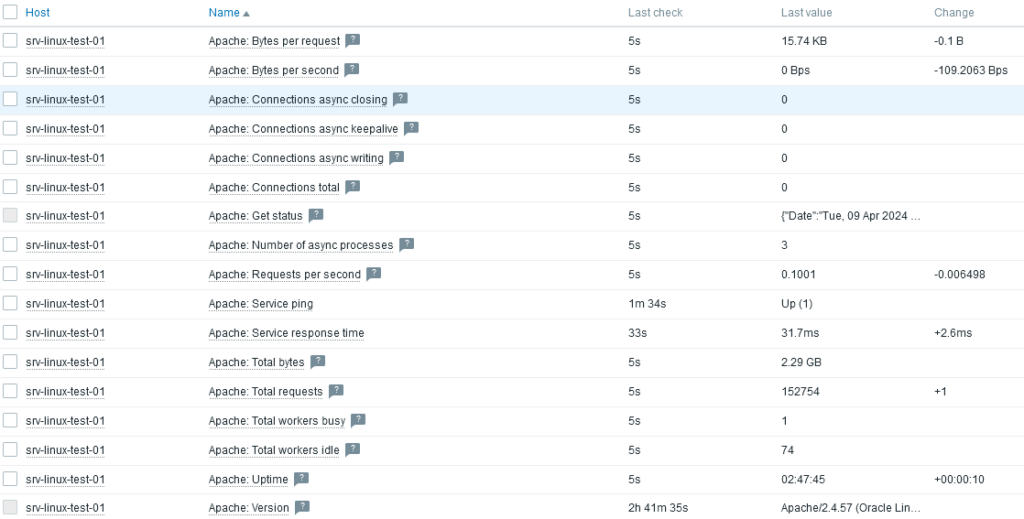
Finally, we can link the template to the host and see that data are collected:
 Tuning
I deployed a simple static web site to the Apache httpd server. To load test that web site, nothing better than JMeter. The load test scenario is simply requesting Home, About, Services and Contact Us pages and retrieve all embedded resources during 2 minutes with 100 threads (ie. users).
Here are the performances on requests per seconds (right scale) and bytes per seconds (left scale):
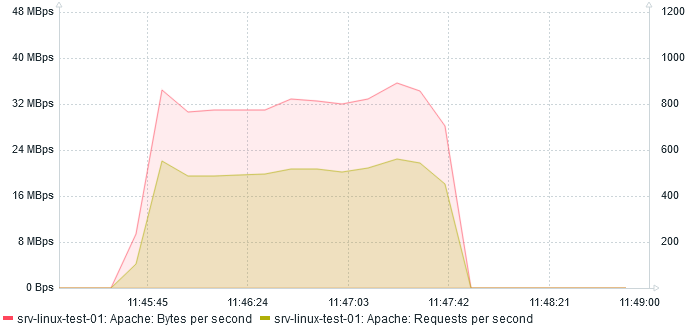
At most, server serves 560 req/s at 35 MBps.
And regarding CPU usage, it almost reaches 10%:
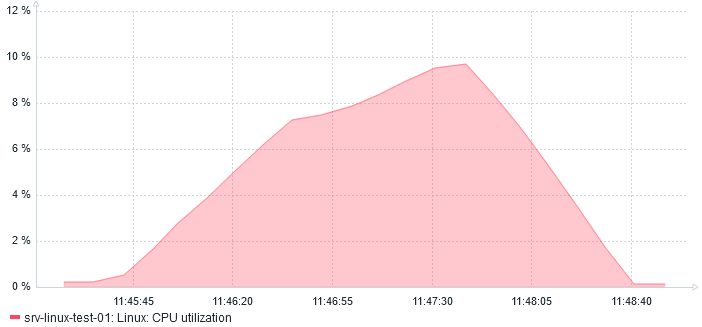 Compression
Without any additional headers, Apache httpd will consider the client (here JMeter) does not support gzip. Fortunately, it is possible to set HTTP Header in JMeter. I add it at the top of the test plan so that it will apply to all HTTP Requests below:
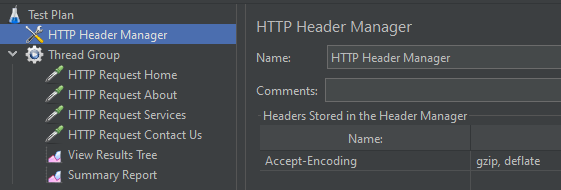
Note that I enabled mod_deflate on Apache side.
Let’s run another load test and compare the results!
After two minutes, here is what I see:
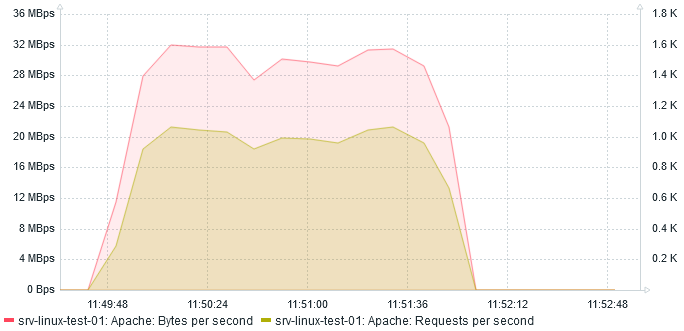
The amount of Mbps reduced to 32 which is expected as we are compressing. The amount of req/s increased by almost 100% to 1000 req/s !
On the CPU side, we also see a huge increase:
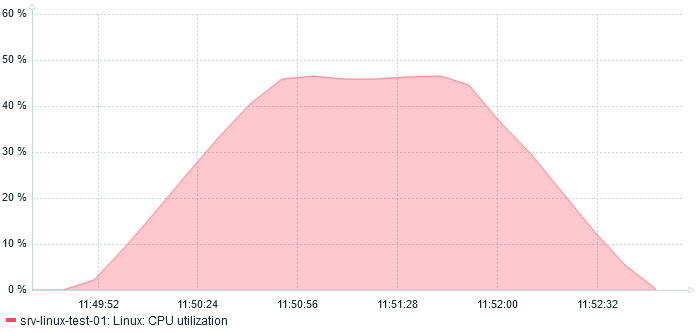 45% CPU usage
This is also more or else expected as compression requires computing.
And NowThe deployed static web site does not have any forms which would require client side compression. That will be a subject for another blog. Also, I can compare with Nginx.
L’article Apache httpd Tuning and Monitoring with Zabbix est apparu en premier sur dbi Blog.
ODA X10-L storage configuration is different from what you may expect
Oracle Database Appliance X10 lineup is available since September 2023. Compared to X9-2 lineup, biggest changes are the AMD Epyc processors replacing Intel Xeons, and new license model regarding Standard Edition 2, clarified by Oracle several weeks ago. Apart from these new things, the models are rather similar to previous ones, with the Small model for basic needs, a HA model with RAC and high-capacity storage for big critical databases, and a much more popular Large model for most of the needs.
2 kinds of disks inside the ODA X10-LThe ODA I’ve worked on is a X10-L with 2x disk expansions, meaning that I have the 2x 6.8TB disks from the base configuration, plus 4x 6.8TB additional disks. The first 4 disks are classic disks visible on the front panel of the ODA. As there are only 4 bays in the front, the other disks are internal, called AIC for Add-In Card (PCIe). You can have up to 3 disk expansions, meaning 4x disks in the front and 4x AIC disks inside the server. You should know that only the front disks are hot swappable. The other disks being PCIe cards, you will need to shut down the server and open its cover to remove, add or replace a disk. 6.8TB is the RAW capacity, consider that real capacity is something like 6.2TB, but usable capacity will be lower as you will need to use ASM redundancy to protect your blocks. In the ODA documentation, you will find the usable capacity for each disk configuration.
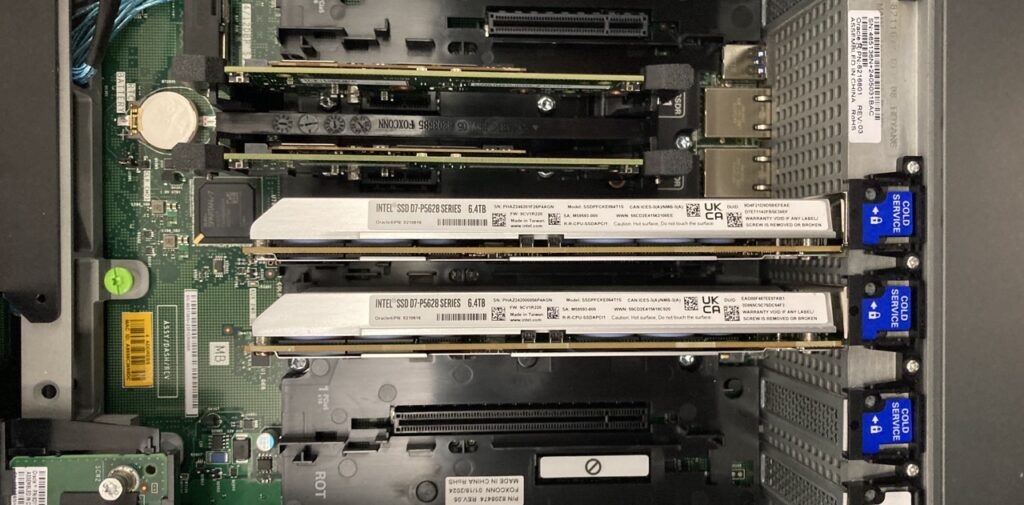
2 AIC disks inside an ODA X10-L. The first 4 disks are in the front.
First contact with X10-L – using odacliodacli describe-system is very useful for an overview of the ODA you’re connected to:
odacli describe-system
Appliance Information
----------------------------------------------------------------
                     ID: 3fcd1093-ea74-4f41-baa1-f325b469a3e1
               Platform: X10-2L
        Data Disk Count: 10
         CPU Core Count: 4
                Created: January 10, 2024 2:26:43 PM CET

System Information
----------------------------------------------------------------
                   Name: dc1oda002
            Domain Name: ad.dbiblogs.ch
              Time Zone: Europe/Zurich
             DB Edition: EE
            DNS Servers: 10.100.50.8 10.100.50.9
            NTP Servers: 10.100.50.8 10.100.50.9


Disk Group Information
----------------------------------------------------------------
DG Name                   Redundancy                Percentage
------------------------- ------------------------- ------------
DATA                      NORMAL                    85
RECO                      NORMAL                    15
Data Disk Count is not what I’ve expected. This is normally the number of DATA disks, it should be 6 on this ODA, not 10.
Let’s do a show disk with odaadmcli:
odaadmcli show disk
        NAME            PATH            TYPE            STATE           STATE_DETAILS
        pd_00           /dev/nvme0n1    NVD             ONLINE          Good
        pd_01           /dev/nvme1n1    NVD             ONLINE          Good
        pd_02           /dev/nvme3n1    NVD             ONLINE          Good
        pd_03           /dev/nvme2n1    NVD             ONLINE          Good
        pd_04_c1        /dev/nvme8n1    NVD             ONLINE          Good
        pd_04_c2        /dev/nvme9n1    NVD             ONLINE          Good
        pd_05_c1        /dev/nvme6n1    NVD             ONLINE          Good
        pd_05_c2        /dev/nvme7n1    NVD             ONLINE          Good
OK, this command only displays the DATA disks, so the system disks are not in this list, but there are still 8 disks and not 6.
Let’s have a look on the system side.
First contact with X10-L – using system commandsWhat is detected by the OS?
lsblk | grep disk
nvme9n1                      259:0       0   3.1T  0 disk
nvme6n1                      259:6       0   3.1T  0 disk
nvme8n1                      259:12      0   3.1T  0 disk
nvme7n1                      259:18      0   3.1T  0 disk
nvme4n1                      259:24      0 447.1G  0 disk
nvme5n1                      259:25      0 447.1G  0 disk
nvme3n1                      259:26      0   6.2T  0 disk
nvme0n1                      259:27      0   6.2T  0 disk
nvme1n1                      259:28      0   6.2T  0 disk
nvme2n1                      259:29      0   6.2T  0 disk
asm/acfsclone-242            250:123905  0   150G  0 disk  /opt/oracle/oak/pkgrepos/orapkgs/clones
asm/commonstore-242          250:123906  0     5G  0 disk  /opt/oracle/dcs/commonstore
asm/odabase_n0-242           250:123907  0    40G  0 disk  /u01/app/odaorabase0
asm/orahome_sh-242           250:123908  0    80G  0 disk  /u01/app/odaorahome
This is rather strange. I can see 10 disks, the 2x 450GB disks are for the system (and normally not considered as DATA disks by odacli), I can also find 4x 6.2TB disks. But instead of having 2x additional 6.2TB disks, I have 4x 3.1TB disks. The overall capacity is OK, 37.2TB, but it’s different compared to previous ODA generations.
Let’s confirm this with fdisk:
fdisk -l /dev/nvme0n1
Disk /dev/nvme0n1: 6.2 TiB, 6801330364416 bytes, 13283848368 sectors
Units: sectors of 1 * 512 = 512 bytes
Sector size (logical/physical): 512 bytes / 512 bytes
I/O size (minimum/optimal): 512 bytes / 512 bytes
Disklabel type: gpt
Disk identifier: E20D9013-1982-4F66-B7A2-5FE0B1BC8F74

Device                Start         End    Sectors   Size Type
/dev/nvme0n1p1         4096  1328386047 1328381952 633.4G Linux filesystem
/dev/nvme0n1p2   1328386048  2656767999 1328381952 633.4G Linux filesystem
/dev/nvme0n1p3   2656768000  3985149951 1328381952 633.4G Linux filesystem
/dev/nvme0n1p4   3985149952  5313531903 1328381952 633.4G Linux filesystem
/dev/nvme0n1p5   5313531904  6641913855 1328381952 633.4G Linux filesystem
/dev/nvme0n1p6   6641913856  7970295807 1328381952 633.4G Linux filesystem
/dev/nvme0n1p7   7970295808  9298677759 1328381952 633.4G Linux filesystem
/dev/nvme0n1p8   9298677760 10627059711 1328381952 633.4G Linux filesystem
/dev/nvme0n1p9  10627059712 11955441663 1328381952 633.4G Linux filesystem
/dev/nvme0n1p10 11955441664 13283823615 1328381952 633.4G Linux filesystem

fdisk -l /dev/nvme8n1
Disk /dev/nvme8n1: 3.1 TiB, 3400670601216 bytes, 6641934768 sectors
Units: sectors of 1 * 512 = 512 bytes
Sector size (logical/physical): 512 bytes / 512 bytes
I/O size (minimum/optimal): 4096 bytes / 4096 bytes
Disklabel type: gpt
Disk identifier: A3086CB0-31EE-4F78-A6A6-47D53149FDAE

Device              Start        End    Sectors   Size Type
/dev/nvme8n1p1       4096 1328386047 1328381952 633.4G Linux filesystem
/dev/nvme8n1p2 1328386048 2656767999 1328381952 633.4G Linux filesystem
/dev/nvme8n1p3 2656768000 3985149951 1328381952 633.4G Linux filesystem
/dev/nvme8n1p4 3985149952 5313531903 1328381952 633.4G Linux filesystem
/dev/nvme8n1p5 5313531904 6641913855 1328381952 633.4G Linux filesystem
OK, the 6.2TB disks are split in 10 partitions, and the 3.1TB disks are split in 5 partitions. It makes sense because ASM needs partitions of the same size inside a diskgroup.
First contact with X10-L – using ASMNow let’s have a look within ASM, the most important thing being that ASM is able to manage the storage correctly:
su - grid
sqlplus / as sysasm
select a.name "Diskgroup" , round(a.total_mb/1024) "Size GB",  round(a.free_mb/1024) "Free GB",   round(a.usable_file_mb/1024) "Usable GB", 100*round((a.total_mb-a.free_mb)/a.total_mb,1) "Use%" from  v$asm_diskgroup a ;
Diskgroup                         Size GB    Free GB  Usable GB       Use%
------------------------------ ---------- ---------- ---------- ----------
DATA                                30404      12341       3637         60
RECO                                 7601       5672       2203         30


select name,total_mb/1024 "GB", GROUP_NUMBER from v$asm_disk order by 3 desc;
NAME                                   GB GROUP_NUMBER
------------------------------ ---------- ------------
NVD_S02_S6UENA0W1072P9         633.421875            2
NVD_S02_S6UENA0W1072P10        633.421875            2
NVD_S05_C2_PHAZ25110P9         633.421875            2
NVD_S05_C2_PHAZ25110P10        633.421875            2
NVD_S03_S6UENA0W1073P10        633.421875            2
NVD_S00_S6UENA0W1075P10        633.421875            2
NVD_S01_S6UENA0W1072P10        633.421875            2
NVD_S00_S6UENA0W1075P9         633.421875            2
NVD_S01_S6UENA0W1072P9         633.421875            2
NVD_S04_C2_PHAZ24710P10        633.421875            2
NVD_S04_C2_PHAZ24710P9         633.421875            2
NVD_S03_S6UENA0W1073P9         633.421875            2
NVD_S05_C1_PHAZ25110P2         633.421875            1
NVD_S00_S6UENA0W1075P8         633.421875            1
NVD_S04_C2_PHAZ24710P6         633.421875            1
NVD_S00_S6UENA0W1075P6         633.421875            1
NVD_S02_S6UENA0W1072P1         633.421875            1
NVD_S05_C1_PHAZ25110P3         633.421875            1
NVD_S04_C1_PHAZ24710P2         633.421875            1
NVD_S03_S6UENA0W1073P4         633.421875            1
NVD_S00_S6UENA0W1075P2         633.421875            1
NVD_S02_S6UENA0W1072P6         633.421875            1
NVD_S05_C2_PHAZ25110P6         633.421875            1
NVD_S00_S6UENA0W1075P7         633.421875            1
NVD_S00_S6UENA0W1075P5         633.421875            1
NVD_S04_C2_PHAZ24710P7         633.421875            1
NVD_S04_C2_PHAZ24710P8         633.421875            1
NVD_S02_S6UENA0W1072P4         633.421875            1
NVD_S03_S6UENA0W1073P7         633.421875            1
NVD_S00_S6UENA0W1075P1         633.421875            1
NVD_S04_C1_PHAZ24710P1         633.421875            1
NVD_S01_S6UENA0W1072P2         633.421875            1
NVD_S01_S6UENA0W1072P1         633.421875            1
NVD_S01_S6UENA0W1072P3         633.421875            1
NVD_S03_S6UENA0W1073P5         633.421875            1
NVD_S01_S6UENA0W1072P4         633.421875            1
NVD_S02_S6UENA0W1072P3         633.421875            1
NVD_S01_S6UENA0W1072P7         633.421875            1
NVD_S02_S6UENA0W1072P7         633.421875            1
NVD_S05_C1_PHAZ25110P1         633.421875            1
NVD_S03_S6UENA0W1073P1         633.421875            1
NVD_S01_S6UENA0W1072P5         633.421875            1
NVD_S05_C1_PHAZ25110P5         633.421875            1
NVD_S04_C1_PHAZ24710P3         633.421875            1
NVD_S00_S6UENA0W1075P3         633.421875            1
NVD_S03_S6UENA0W1073P6         633.421875            1
NVD_S02_S6UENA0W1072P8         633.421875            1
NVD_S00_S6UENA0W1075P4         633.421875            1
NVD_S04_C1_PHAZ24710P5         633.421875            1
NVD_S01_S6UENA0W1072P8         633.421875            1
NVD_S04_C1_PHAZ24710P4         633.421875            1
NVD_S03_S6UENA0W1073P3         633.421875            1
NVD_S05_C1_PHAZ25110P4         633.421875            1
NVD_S03_S6UENA0W1073P2         633.421875            1
NVD_S01_S6UENA0W1072P6         633.421875            1
NVD_S05_C2_PHAZ25110P8         633.421875            1
NVD_S02_S6UENA0W1072P5         633.421875            1
NVD_S02_S6UENA0W1072P2         633.421875            1
NVD_S03_S6UENA0W1073P8         633.421875            1
NVD_S05_C2_PHAZ25110P7         633.421875            1
This is also different from older generations. On X9-2 lineup, the RECO diskgroup (group 2) has as many partitions as diskgroup DATA (group 1). This is no more the way it works. But regarding the free and usable GB, everything is fine.
Why Oracle did differently from older ODAs?Oldest ODAs were using spinning disks, and for maximizing performance, Oracle created 2 partitions on each disk: one for DATA on the external part of the disk, and one for RECO on the internal part of the disk. All the DATA partitions were then added to the DATA diskgroup, and all RECO partitions to the RECO diskgroup. The more disks you had, the faster the read and write speed was. Redologs had their own dedicated disks, usually 4 small SSDs using high redundancy.
Nowadays, ODAs are mostly using SSDs, and read and write speed is identical wherever the block is. And the number of disks doesn’t matter, speed is mostly limited by the PCIe bandwidth and chips on the SSDs, but as far as I know, the speed of one NVMe SSD is enough for 95% of the databases.
Internal AIC disks on ODA X10-L are split in two disks for some reasons, so it’s not possible anymore to have the big partitions we had before.
ConclusionThis X10-L was initially deployed using version 19.21. As it wasn’t already in use, and to make sure everything is fine on the hardware and software side, it was decided to do a fresh reimaging using latest 19.22. It didn’t change anything, odacli still sees 10 disks, but apart from that, everything is fine.
Disk size and partitioning is now different, but it won’t change anything for most of us.
L’article ODA X10-L storage configuration is different from what you may expect est apparu en premier sur dbi Blog.
PostgreSQL 17: Split and Merge partitions
Since declarative partitioning was introduced in PostgreSQL 10 there have been several additions and enhancements throughout the PostgreSQL releases. PostgreSQL 17, expected to be released around September/October this year, is no exception to that and will come with two new features when it comes to partitioning: Splitting and Merging partitions.
Before we can have a look at that, we need a partitioned table, some partitions and some data, so lets generate this. Splitting and Merging works for range and list partitioning and because most of the examples for partitioning you can find online go for range partitioning, we’ll go for list partitioning in this post:
postgres=# create table t ( a int, b text ) partition by list (b);
CREATE TABLE
postgres=# \d+ t
Partitioned table "public.t"
Column | Type | Collation | Nullable | Default | Storage | Compression | Stats target | Description
--------+---------+-----------+----------+---------+----------+-------------+--------------+-------------
a | integer | | | | plain | | |
b | text | | | | extended | | |
Partition key: LIST (b)
Number of partitions: 0

postgres=# create table t_p1 partition of t for values in ('a');
CREATE TABLE
postgres=# create table t_p2 partition of t for values in ('b');
CREATE TABLE
postgres=# create table t_p3 partition of t for values in ('c');
CREATE TABLE
postgres=# create table t_p4 partition of t for values in ('d');
CREATE TABLE
postgres=# \d+ t
                                      Partitioned table "public.t"
 Column |  Type   | Collation | Nullable | Default | Storage  | Compression | Stats target | Description
--------+---------+-----------+----------+---------+----------+-------------+--------------+-------------
 a      | integer |           |          |         | plain    |             |              |
 b      | text    |           |          |         | extended |             |              |
Partition key: LIST (b)
Partitions: t_p1 FOR VALUES IN ('a'),
            t_p2 FOR VALUES IN ('b'),
            t_p3 FOR VALUES IN ('c'),
            t_p4 FOR VALUES IN ('d')
This gives us a simple list partitioned table and four partitions. Lets add some data to the partitions:
postgres=# insert into t select i, 'a' from generate_series(1,100) i;
INSERT 0 100
postgres=# insert into t select i, 'b' from generate_series(101,200) i;
INSERT 0 100
postgres=# insert into t select i, 'c' from generate_series(201,300) i;
INSERT 0 100
postgres=# insert into t select i, 'd' from generate_series(301,400) i;
INSERT 0 100
postgres=# select count(*) from t_p1;
 count
-------
   100
(1 row)

postgres=# select count(*) from t_p2;
 count
-------
   100
(1 row)

postgres=# select count(*) from t_p3;
 count
-------
   100
(1 row)

postgres=# select count(*) from t_p4;
 count
-------
   100
(1 row)
Suppose we want to merge the first two partitions, containing values of ‘a’ and ‘b’. This can now be easily done with the new merge partition DDL command:
postgres=# alter table t merge partitions (t_p1, t_p2) into t_p12;
ALTER TABLE
postgres=# \d+ t
                                      Partitioned table "public.t"
 Column |  Type   | Collation | Nullable | Default | Storage  | Compression | Stats target | Description
--------+---------+-----------+----------+---------+----------+-------------+--------------+-------------
 a      | integer |           |          |         | plain    |             |              |
 b      | text    |           |          |         | extended |             |              |
Partition key: LIST (b)
Partitions: t_p12 FOR VALUES IN ('a', 'b'),
            t_p3 FOR VALUES IN ('c'),
            t_p4 FOR VALUES IN ('d')
The same the other way around: Splitting the new combined partition into single partitions:
postgres=# alter table t split partition t_p12 into ( partition t_p1 for values in ('a'), partition t_p2 for values in ('b'));
ALTER TABLE
postgres=# \d+ t
                                      Partitioned table "public.t"
 Column |  Type   | Collation | Nullable | Default | Storage  | Comp>
--------+---------+-----------+----------+---------+----------+----->
 a      | integer |           |          |         | plain    |     >
 b      | text    |           |          |         | extended |     >
Partition key: LIST (b)
Partitions: t_p1 FOR VALUES IN ('a'),
            t_p2 FOR VALUES IN ('b'),
            t_p3 FOR VALUES IN ('c'),
            t_p4 FOR VALUES IN ('d')
Nice, but there currently is a downside with this: Both operations will take an “ACCESS EXCLUSIVE LOCK” on the parent table, so everything against that table will be blocked for the time it takes to either split or merge the partitions. I am not to worried about that, as this was the same with other features related to partitioning in the past. Over time, locking was reduced and I guess this will be the same with this feature.
L’article PostgreSQL 17: Split and Merge partitions est apparu en premier sur dbi Blog.
DevOps Best Practice – Backup and Share your work with GitHub
With my mate Chay Te (our DevOps champion in all categories and the mastermind of this best practice) we worked on scripts for our new Kubernetes security talk. These scripts where stored in our EC2 instance but this should not be their permanent location. First the EC2 instance could be deleted and we would lose everything. Then we need to version these files and keep track of the changes between us two. It was time to apply DevOps best practice for our scripts and we decided to use GitHub for this purpose. Read on to learn how to backup and share your work with GitHub in this step-by-step guide!
GitHubThe first step is to sign up for a GitHub account if you don’t already have one.

Then you can create your first repository (also called repo for short) by giving it a name. You can select a Private repo if the files you share are private (it was in our case). So far so good, nothing complicated here!
Now you want to connect from your EC2 instance (in our case but it could be any type of machine) to this repo and push your scripts. Before you can do that, there is some configuration to do in GitHub. You have to create a Personal Access Token (PAT) to allow this connection. Click on your profile in the top right corner and select Settings. Then choose Developer Settings and you will reach the PAT menu. Here there are 2 choices between a fine-grained and a classic token. The first one is in Beta and allow you to choose which access you want to give to each element of your repo. You give it a name and the token will be generated for you. It has an expiration date and you have to keep it somewhere safe like a password as you will not be able to retrieve it later.

You can now use your GitHub account name and this token to synchronize your scripts or files between EC2 and this repo.
The last thing to configure in GitHub is to invite your collaborators to access your repo. Click on Add people and enter the email address of your collaborator. She/He will receive an invite to accept to join you in this repo.
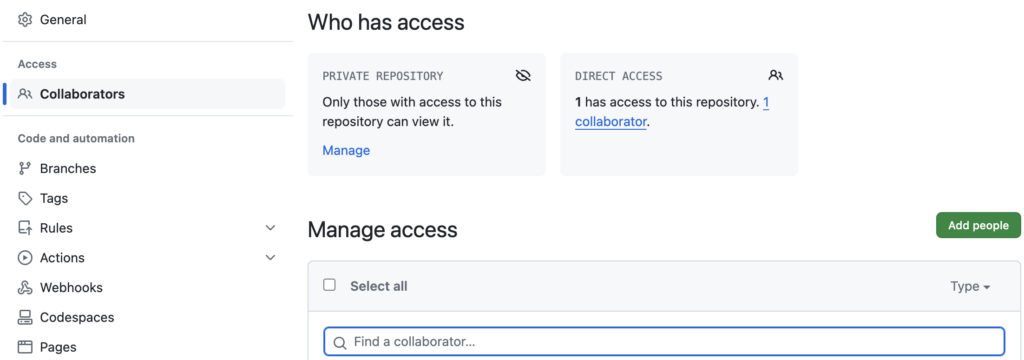
Creating a repo and collaborating in it is part of DevOps best practice!
Git commands in EC2Your GitHub repo is now ready so let’s use it and backup your scripts in it. Another DevOps best practice is to use Git as the CLI tool in our machine.
On the EC2 instance, the easiest way to proceed is to clone your GitHub repo (we give it the name MyNewRepo) with Git as follows:
$ git clone https://github.com/mygithubaccount/MyNewRepo.git
You will be asked to authenticate with your GitHub account name (here mygithubaccount) and use the PAT you have created above as password. In your EC2 instance you now have a new folder called MyNewRepo. At this stage it is empty. Go into it and set the Git configuration:
$ cd MyNewRepo

$ git config --global user.email "benoit.entzmann@dbi-services.com"
$ git config --global user.name "Benoit Entzmann"
$ git branch -M main
$ git remote add origin https://github.com/mygithubaccount/MyNewRepo.git
You set the global email and username you will use with Git. By default there is one Git branch that is called Master. Rename it as main. Finally set up a connection between your local Git repository and your remote repository.
Next copy or move all of your script files into this folder as shown in the example below:
$ cp -Rp ~/MyScripts/* ./
Now all of your script files are in right folder and you just need to add them to the local Git repo and push them to your repo in GitHub:
$ git add .
$ git commit -m "My scripts"
$ git push -u origin main
And this is it! You can just check in GitHub that all of your script files are now in the repo called MyNewRepo.
Wrap upIn a few steps we have seen how to backup your script files by using a repository in GitHub. You have not only backup your files, you have also setup the GitHub environment to collaborate in this repo. This is a DevOps best practice!
Now in case of a failure or accidental deletion of your EC2 (yes Instance state -> Terminate instance can happen!), you will be able to clone again your repo from GitHub and quickly get back on track with your scripts!
L’article DevOps Best Practice – Backup and Share your work with GitHub est apparu en premier sur dbi Blog.
Faster Ansible
Even if Ansible is powerful and flexible, it can be considered “slow”. It will be anyway faster, and more consistent, than doing the same steps manually. Nevertheless, we will experiment to make it even faster. I found few of them on the Internet, but rarely with figures of what to expect.
In this blog post, I will cover one of them and run different scenarios. We will also dig inside some internal mechanism used by Ansible.
SSH ConnectionsAnsible is connection intensive as it opens, and closes, many ssh connections to the targeted hosts.
I found two possible ways to count the amount of connections from control to agents nodes:
- Add
-vvvoption to the ansible-playbook command. - grep audit.log file:
tail -f /var/log/audit/audit | grep USER_LOGIN
First option is really too much verbose, but I used it with the first playbook below to confirm the second option give the same count.
Simple PlaybookTo demonstrate that, let’s start with a very minimal playbook without fact gathering:
---
- name: Test playbook
  hosts: all
  gather_facts: false
  pre_tasks:
    - name: "ping"
      ansible.builtin.ping:
...
This playbook triggered 8 ssh connections to the target host. If I enable facts gathering, count goes to 14 connections. Again, this is quiet a lot knowing that playbook does not do much beside check target is alive.
To summarize:
gather_factsconnectionstiming (s)false81,277true141,991ping playbook results What are All These Connection For?To determine what are these connections doing, we can analyze verbose (really verbose!!) output of Ansible playbook without fact gathering.
First ConnectionFirst command of first connection is echo ~opc && sleep 0 which will return the home directory of ansible user.
Second command is already scary:
( umask 77 && mkdir -p "` echo /home/opc/.ansible/tmp `"&& mkdir "` echo /home/opc/.ansible/tmp/ansible-tmp-1712570792.3350322-23674-205520350912482 `" && echo ansible-tmp-1712570792.3350322-23674-205520350912482="` echo /home/opc/.ansible/tmp/ansible-tmp-1712570792.3350322-23674-205520350912482 `" ) && sleep 0- It set the umask for the commands to follow.
- Create tmp directory to store any python script on target
- In that directory, create a directory to store the script for this specific task
- Makes this ssh command return the temporary variable with full path to the task script directory
- sleep 0
This one is mainly to ensure directory structure exists on the target.
ThirdI will not paste this one here as it is very long and we can easily guess what it does with log just before:
Attempting python interpreter discoveryRoughly, what it does, it tries many versions of python.
FourthNext, it will run a python script with discovered python version to determine Operating System type and release.
FifthFifth connection is actually a sftp command to copy module content (AnsiballZ_ping.py). AnsiballZ is a framework to embed module into script itself. This allows to be run modules with a single Python copy.
SeventhThis one is simply ensuring execution permission is set on temporary directory (ie. ansible-tmp-1712570792.3350322-23674-205520350912482) as well the python script (ie. AnsiballZ_ping.py).
Eighth and Last ConnectionLastly, the execution of the ping module itself:
/usr/bin/python3.9 /home/opc/.ansible/tmp/ansible-tmp-1712570792.3350322-23674-205520350912482/AnsiballZ_ping.py && sleep 0To reduce the amount of connection, there is one possible option: Pipelining
To enable that, I simply need to add following line in ansible.cfg:
pipelining = true
Or set ANSIBLE_PIPELINING environment variable to true.
How does it improve our playbook execution time:
gather_factsconnectionstiming (s)false3 (-62%)0,473 (-63%)true4 (-71%)1,275 (-36%)ping playbook results with pipeliningAs we can see there is a significant reduction on the amount of ssh connections as well as a reduction of the playbook duration.
In this configuration, only 3 connections are made:
- python interpreter discovery (connection #3)
- OS type discovery (connection #4)
- python module execution (connection #8). AnsiballZ data is piped to that process.
With the pipelining option, I also noticed that the Ansible temporary directory is not created.
Of course, we can’t expect such big speed-up on a real life playbook. So, we should do it now.
Deploy WebLogic Server PlaybookLet’s use the WebLogic YaK component to deploy a single WebLogic instance. It includes dbi service best practices, latest CPU patches and SSL configuration. The “normal” run takes 13 minutes 30 seconds when the pipelined run takes 12 minutes 13 seconds. This is 10% faster.
This is nice, but not as good as previous playbook. Why is that? Because most of the time is not spent in ssh connections, but with actual work (running WebLogic installer, starting services, patching with OPatch, etc).
What Next?With such results, you might wonder why isn’t it enabled by default? As per documentation, there is a limitation:
This can conflict with privilege escalation (become). For example, when using sudo operations you must first disable ‘requiretty’ in the sudoers file for the target hosts, which is why this feature is disabled by default.
Ansible documentationUntil now, with all tests I have made, I never encountered that limitation. Did you?
L’article Faster Ansible est apparu en premier sur dbi Blog.
PostgreSQL 17: Add allow_alter_system GUC
Some time ago I’ve written about the options to disable the “alter system” command in PostgreSQL. While there is nothing up to PostgreSQL 16 to do this natively, there are solutions for this requirement (see linked post). PostgreSQL 17 will change that and will come with an in-core option to disable the “alter system” command.
The parameter to control this is called “allow_alter_system”, which by default is turned to on:
postgres=# \dconfig *alter_system*
List of configuration parameters
     Parameter      | Value
--------------------+-------
 allow_alter_system | on
(1 row)
Changing this parameter via “alter system” does not make much sense, so this will obviously generate an error:
postgres=# alter system set allow_alter_system = off;
ERROR:  parameter "allow_alter_system" cannot be changed
postgres=#
If you want to change this, you need to do this directly in the configuration file:
postgres=# \! echo "allow_alter_system=off" >> $PGDATA/postgresql.auto.conf
As this parameter has a “context” of SIGHUP, a simple reload makes this change active:
postgres=# select context from pg_settings where name = 'allow_alter_system';
 context
---------
 sighup
(1 row)

postgres=# select pg_reload_conf();
 pg_reload_conf
----------------
 t
(1 row)

postgres=# \dconfig *alter_system*
List of configuration parameters
     Parameter      | Value
--------------------+-------
 allow_alter_system | off
(1 row)
From now on, any attempt to change the system’s configuration with “alter system” will trigger an error:
postgres=# alter system set work_mem='12MB';
ERROR:  ALTER SYSTEM is not allowed in this environment
This makes sense for systems, where the configuration is managed externally, e.g. by an operator or configuration management tools.
Please note that this is not considered a security feature as super users have other ways of modifying the configuration, e.g. by executing shell commands.
L’article PostgreSQL 17: Add allow_alter_system GUC est apparu en premier sur dbi Blog.
ODA patching: ASR manager stuck to old version
Patching an Oracle Database Appliance is mainly applying 3 patches: the system patch, including OS and Grid Infrastructure updates, the storage patch for data disks and disk controllers, and the DB patch for DB homes and databases. ASR manager (Automatic Service Request) update is included in the system patch. And it’s normally not a topic when patching an ODA, it’s a small module and update is done without any problem in most cases. Using ASR is recommended as its purpose is to automatically open a Service Request on My Oracle Support when hardware failure is detected by the system: don’t miss this important feature.
When patching an ODA X8-2M from 19.18 to 19.20, I discovered that ASR manager was not in the correct version. How could I solve this problem?
Status of my componentsI always check the version of the ODA components prior applying a patch, just because it’s better to know where you started. Regarding the ASR manager on my ODA, it’s not OK because version doesn’t match the one delivered within 19.18 patch:
odacli describe-component
System Version
---------------
19.18.0.0.0

System node Name
---------------
oda01val

Local System Version
---------------
19.18.0.0.0

Component                                Installed Version    Available Version
---------------------------------------- -------------------- --------------------
OAK
                                          19.18.0.0.0           up-to-date
GI
                                          19.18.0.0.230117      up-to-date
...

ASR
                                          20.3.0                22.2.0
HMP
2.4.8.9.604 up-to-date You should know that you can retry the system patch without any problem. odacli will skip the already patched modules, and try to patch the components that are not in the target version. So this is the first thing you could do:
odacli create-prepatchreport -s -v 19.18.0.0.0
odacli describe-prepatchreport -i 91c48ee7-bffb-4ff7-9452-93b6d2c413d3
Patch pre-check report
------------------------------------------------------------------------
                 Job ID:  91c48ee7-bffb-4ff7-9452-93b6d2c413d3
            Description:  Patch pre-checks for [OS, ILOM, GI, ORACHKSERVER, SERVER]
                 Status:  SUCCESS
                Created:  April 2, 2024 12:24:15 PM CEST
                 Result:  All pre-checks succeeded

...
odacli update-server -v 19.18.0.0.0
odacli describe-job -i 3d72b49a-c201-42e2-9da9-e5e55d5b5e86
Job details
----------------------------------------------------------------
                     ID:  3d72b49a-c201-42e2-9da9-e5e55d5b5e86
            Description:  Server Patching
                 Status:  Success
                Created:  April 2, 2024 12:32:23 PM CEST
                Message:
...
odacli describe-component | tail -n 5
ASR
                                          20.3.0                22.2.0
HMP
                                          2.4.8.9.604           up-to-date
It didn’t help.
Trying the 19.20 patchAs I need to go to 19.20, let’s try applying this system patch and see if it’s better:
odacli create-prepatchreport -s -v 19.20.0.0.0
odacli describe-prepatchreport -i 13919f5c-753e-4340-818d-b04022419938
Patch pre-check report
------------------------------------------------------------------------
                 Job ID:  13919f5c-753e-4340-818d-b04022419938
            Description:  Patch pre-checks for [OS, ILOM, GI, ORACHKSERVER, SERVER]
                 Status:  SUCCESS
                Created:  April 2, 2024 3:50:29 PM CEST
                 Result:  All pre-checks succeeded
...
odacli update-server -v 19.20.0.0.0
odacli describe-job -i 367476ef-1c67-4521-8c96-eb2dd8ad37ca
Job details
----------------------------------------------------------------
                     ID:  367476ef-1c67-4521-8c96-eb2dd8ad37ca
            Description:  Server Patching
                 Status:  Success
                Created:  April 2, 2024 3:59:44 PM CEST
                Message:  Successfully patched GI with RHP
...
Let’s check the version of ASR manager:
odacli describe-component | tail -n 5
ASR
                                          20.3.0                23.1.0
HMP
                                          2.4.9.0.601           up-to-date
Still stuck to this old 20.3.0 release!
Troubleshooting why it’s stuckLet’s have a look of what’s inside this ASR manager:
ls -lrt /var/opt/asrmanager/log/
total 5188
-rw-r--r-- 1 asrmgr asrmgr       0 Feb 17  2022 service-request.log
-rw-r--r-- 1 asrmgr asrmgr       0 Feb 17  2022 file-upload.log
-rw-r--r-- 1 asrmgr asrmgr       0 Feb 17  2022 trap-accepted.log
-rw-r--r-- 1 asrmgr asrmgr       0 Feb 17  2022 trap-rejected.log
drwxr-xr-x 2 asrmgr asrmgr    4096 Feb 17  2022 sftransport
-rw-r--r-- 1 asrmgr asrmgr     106 Feb 17  2022 autoupdate.log
-rw-r--r-- 1 asrmgr asrmgr       0 Aug 17  2022 derby.log.0.lck
-rw-r--r-- 1 asrmgr asrmgr  708474 Dec 19  2022 derby.log.0
drwxr-xr-x 2 asrmgr asrmgr    4096 Jan 19  2023 auditlog
-rw-r--r-- 1 asrmgr asrmgr    4341 May 19  2023 zfssa-proxy.log
-rw-r--r-- 1 asrmgr asrmgr 1407270 May 19  2023 memory.log
-rw-r--r-- 1 asrmgr asrmgr    8518 May 19  2023 asr-http.log
-rw-r--r-- 1 asrmgr asrmgr    2208 May 19  2023 remote-request.log
-rw-r--r-- 1 asrmgr asrmgr   23388 May 19  2023 asr-snmp.log
-rw-r--r-- 1 asrmgr asrmgr 3118352 May 19  2023 asr.log
No log since last year, this component is probably not running anymore:
/opt/asrmanager/util/check_asr_status.sh
Checking ASR Manager status ..............
PASS: anaconda-ks.cfg copy-DIA003AP.sh copy-DIV002AP.sh copy-ERPPROD.sh Extras iar-cm22_cmdb_itasm_server.sh iar-info-acfs-asm.sh imaging_status.log initreboot.sh original-ks.cfg osimagelogs_2022-02-07-10-35.tar.gz perl5 post-ks-chroot.log post-ks-nochroot.log setupNetwork stderr.txt stdout.txt JAVA is not found. Please set 'java.exec' property in file /var/opt/asrmanager/configuration/asr.conf to point to JAVA 1.8 or later and try again ****************************************************************
PASS: ASR Manager SNMP listener is running (SNMP port anaconda-ks.cfg copy-DIA003AP.sh copy-DIV002AP.sh copy-ERPPROD.sh Extras iar-cm22_cmdb_itasm_server.sh iar-info-acfs-asm.sh imaging_status.log initreboot.sh original-ks.cfg osimagelogs_2022-02-07-10-35.tar.gz perl5 post-ks-chroot.log post-ks-nochroot.log setupNetwork stderr.txt stdout.txt JAVA is not found. Please set 'java.exec' property in file /var/opt/asrmanager/configuration/asr.conf to point to JAVA 1.8 or later and try again ****************************************************************).
PASS: ASR Manager HTTP receiver is running (HTTP port anaconda-ks.cfg copy-DIA003AP.sh copy-DIV002AP.sh copy-ERPPROD.sh Extras iar-cm22_cmdb_itasm_server.sh iar-info-acfs-asm.sh imaging_status.log initreboot.sh original-ks.cfg osimagelogs_2022-02-07-10-35.tar.gz perl5 post-ks-chroot.log post-ks-nochroot.log setupNetwork stderr.txt stdout.txt JAVA is not found. Please set 'java.exec' property in file /var/opt/asrmanager/configuration/asr.conf to point to JAVA 1.8 or later and try again ****************************************************************).
PASS: ASR Manager Oracle transport endpoint is set correctly. [**************************************************************** JAVA is not found. Please set 'java.exec' property in file /var/opt/asrmanager/configuration/asr.conf to point to JAVA 1.8 or later and try again ****************************************************************]
PASS: ASR Manager site id anaconda-ks.cfg copy-DIA003AP.sh copy-DIV002AP.sh copy-ERPPROD.sh Extras iar-cm22_cmdb_itasm_server.sh iar-info-acfs-asm.sh imaging_status.log initreboot.sh original-ks.cfg osimagelogs_2022-02-07-10-35.tar.gz perl5 post-ks-chroot.log post-ks-nochroot.log setupNetwork stderr.txt stdout.txt JAVA is not found. Please set 'java.exec' property in file /var/opt/asrmanager/configuration/asr.conf to point to JAVA 1.8 or later and try again ****************************************************************.
PASS: ASR Manager registration id anaconda-ks.cfg copy-DIA003AP.sh copy-DIV002AP.sh copy-ERPPROD.sh Extras iar-cm22_cmdb_itasm_server.sh iar-info-acfs-asm.sh imaging_status.log initreboot.sh original-ks.cfg osimagelogs_2022-02-07-10-35.tar.gz perl5 post-ks-chroot.log post-ks-nochroot.log setupNetwork stderr.txt stdout.txt JAVA is not found. Please set 'java.exec' property in file /var/opt/asrmanager/configuration/asr.conf to point to JAVA 1.8 or later and try again ****************************************************************.
PASS: ASR Manager logging level anaconda-ks.cfg copy-DIA003AP.sh copy-DIV002AP.sh copy-ERPPROD.sh Extras iar-cm22_cmdb_itasm_server.sh iar-info-acfs-asm.sh imaging_status.log initreboot.sh original-ks.cfg osimagelogs_2022-02-07-10-35.tar.gz perl5 post-ks-chroot.log post-ks-nochroot.log setupNetwork stderr.txt stdout.txt JAVA is not found. Please set 'java.exec' property in file /var/opt/asrmanager/configuration/asr.conf to point to JAVA 1.8 or later and try again ****************************************************************.
FAIL: ASR Manager bundles state is NOT active.
FAIL: ASR Manager missing version.
FAIL: ASR Manager database connectivity is not working.
FAIL: ASR Manager process is not running.
FAIL: ASR Autoupdate bundles state is NOT active.
Please refer to ASR documentation for troubleshooting steps.
It looks like the problem is related to Java, a configuration file describes the Java path:
cat /var/opt/asrmanager/configuration/asr.conf
java.exec=/opt/oracle/dcs/java/1.8.0_281/bin/java

ls /opt/oracle/dcs/java/1.8.0_281/bin/java
ls: cannot access /opt/oracle/dcs/java/1.8.0_281/bin/java: No such file or directory

ls /opt/oracle/dcs/java/1.8.0_381/bin/java
/opt/oracle/dcs/java/1.8.0_381/bin/java
OK, the Java path is not correct, let’s change it and check the status:
sed -i 's/281/381/g' /var/opt/asrmanager/configuration/asr.conf

/opt/asrmanager/util/check_asr_status.sh
Checking ASR Manager status ..............
PASS: ASR Manager site id ASR Manager is NOT RUNNING..
PASS: ASR Manager registration id ASR Manager is NOT RUNNING..
PASS: ASR Manager logging level ASR Manager is NOT RUNNING..
FAIL: ASR Manager is NOT RUNNING.
FAIL: ASR Manager bundles state is NOT active.
FAIL: ASR Manager SNMP listener is not running.
FAIL: ASR Manager HTTP receiver is not running.
FAIL: ASR Manager missing version.
FAIL: ASR Manager database connectivity is not working.
FAIL: ASR Manager Oracle transport end point is incorrectly set.
FAIL: ASR Manager process is not running.
FAIL: ASR Autoupdate bundles state is NOT active.
Please refer to ASR documentation for troubleshooting steps.
It’s better now. Let’s retry the system patch:
odacli create-prepatchreport -s -v 19.20.0.0.0
odacli describe-prepatchreport -i 2d60dbdf-9c51-467f-858c-ccf6226b1828
Patch pre-check report
------------------------------------------------------------------------
                 Job ID:  2d60dbdf-9c51-467f-858c-ccf6226b1828
            Description:  Patch pre-checks for [OS, ILOM, GI, ORACHKSERVER, SERVER]
                 Status:  SUCCESS
                Created:  April 2, 2024 5:44:51 PM CEST
                 Result:  All pre-checks succeeded
...
odacli update-server -v 19.20.0.0.0
...
odacli describe-job -i 05a10cf6-7856-494f-b434-04ea7b0b0c8d
Job details
----------------------------------------------------------------
                     ID:  05a10cf6-7856-494f-b434-04ea7b0b0c8d
            Description:  Server Patching
                 Status:  Success
                Created:  April 3, 2024 9:20:46 AM CEST
                Message:
...
OK, and let’s check the version of ASR manager:
odacli describe-component | tail -n 5
ASR
                                          20.3.0                23.1.0
HMP
                                          2.4.9.0.601           up-to-date
Not better…
ASR manager is an RPMI discovered that ASR manager is an RPM package, meaning that update may be quite easy.
rpm -qa | grep asr
asrmanager-20.3.0-1.noarch
Newest version should be in the ODA repository:
ls -lrth /opt/oracle/oak/pkgrepos/asr/23.1.0/asrmanager-23.1.0-20230320145431.rpm
-rw-r--r-- 1 root root 40M Aug  3  2023 /opt/oracle/oak/pkgrepos/asr/23.1.0/asrmanager-23.1.0-20230320145431.rpm
OK, so let’s upgrade this ASR manager:
service asrm stop
ASR Manager is stopped.

yum localupdate /opt/oracle/oak/pkgrepos/asr/23.1.0/asrmanager-23.1.0-20230320145431.rpm
Loaded plugins: langpacks, priorities, ulninfo, versionlock
Examining /opt/oracle/oak/pkgrepos/asr/23.1.0/asrmanager-23.1.0-20230320145431.rpm: asrmanager-23.1.0-1.noarch
Marking /opt/oracle/oak/pkgrepos/asr/23.1.0/asrmanager-23.1.0-20230320145431.rpm as an update to asrmanager-20.3.0-1.noarch
Resolving Dependencies
--> Running transaction check
---> Package asrmanager.noarch 0:20.3.0-1 will be updated
---> Package asrmanager.noarch 0:23.1.0-1 will be an update
--> Finished Dependency Resolution
ol7_UEKR6/x86_64                                                                                                                                                      | 3.0 kB  00:00:00
ol7_UEKR6/x86_64/updateinfo                                                                                                                                           | 1.1 MB  00:00:00
ol7_UEKR6/x86_64/primary_db                                                                                                                                           |  72 MB  00:00:00
ol7_latest/x86_64                                                                                                                                                     | 3.6 kB  00:00:00
ol7_latest/x86_64/group_gz                                                                                                                                            | 136 kB  00:00:00

ol7_latest/x86_64/updateinfo                                                                                                                                          | 3.6 MB  00:00:00
ol7_latest/x86_64/primary_db                                                                                                                                          |  51 MB  00:00:00

Dependencies Resolved

=============================================================================================================================================================================================
 Package                                  Arch                                 Version                                 Repository                                                       Size
=============================================================================================================================================================================================
Updating:
 asrmanager                               noarch                               23.1.0-1                                /asrmanager-23.1.0-20230320145431                                45 M

Transaction Summary
=============================================================================================================================================================================================
Upgrade  1 Package

Total size: 45 M
Is this ok [y/d/N]: y
Downloading packages:
Running transaction check
Running transaction test
Transaction test succeeded
Running transaction
Warning: RPMDB altered outside of yum.

Please enter 'yes' or 'no'
yes

Copyright [2008,2016], Oracle and/or its affiliates. All rights reserved.

License and Terms of Use for this software are described at https://support.oracle.com/ (see Legal Notices and Terms of Use).

****************************************************************
Warning: ASR Manager should be run as asrmgr for better security.
Doing so will mean changing the default 162 port or configuring
your system to enable asrmgr to access port 162.
****************************************************************

Please review the security readme for more details.
  Updating   : asrmanager-23.1.0-1.noarch                                                                                                                                                1/2

*******************************************************
To allow a non-root user to manage ASR Manager service:
Add the following line to /etc/sudoers file
'<userName> ALL=(root) NOPASSWD:/opt/asrmanager/bin/asr start,/opt/asrmanager/bin/asr stop,/opt/asrmanager/bin/asr status,/opt/asrmanager/bin/asr restart'
*******************************************************
Starting ASR Manager
ASR Manager (pid 13055) is RUNNING.
Upgrading ASR Manager bundles...
Successfully installed ASR Manager bundles.
Adding the systemctl ASR Manager (asrm-startup) service.
Removing the original chkconfig ASR Manager (asrm) service.

Note: This output shows SysV services only and does not include native
      systemd services. SysV configuration data might be overridden by native
      systemd configuration.

      If you want to list systemd services use 'systemctl list-unit-files'.
      To see services enabled on particular target use
      'systemctl list-dependencies [target]'.

ASR AUTOUPDATE (asra) service exists.
ASR Manager is stopped.
ASR Manager (pid 17323) is RUNNING.

The ASR Manager application is installed in '/opt/asrmanager'. Log files are located in '/var/opt/asrmanager'.
ASR Administration command is now available at /opt/asrmanager/bin/asr.

Checking ASR Manager status ..
FAIL: ASR Manager missing registration id.
Please refer to ASR documentation for troubleshooting steps.
apply.db.schema.changes is set to yes

Update SFT listener.xml ...
Installation of asrmanager was successful.
Checking ASR Manager snmp port ..
The ASR Manager SNMP listener port is set to 162 and is able to receive SNMP traps from assets.
  Cleanup    : asrmanager-20.3.0-1.noarch                                                                                                                                                2/2
  Verifying  : asrmanager-23.1.0-1.noarch                                                                                                                                                1/2
  Verifying  : asrmanager-20.3.0-1.noarch                                                                                                                                                2/2

Updated:
  asrmanager.noarch 0:23.1.0-1

Complete!

service asrm status
ASR Manager (pid 17323) is RUNNING.


odacli describe-component | tail -n 5
ASR
                                          23.1.0                up-to-date
HMP
                                          2.4.9.0.601           up-to-date

/opt/asrmanager/util/check_asr_status.sh
Checking ASR Manager status ..
PASS: ASR Manager (pid 17323) is RUNNING.
PASS: ASR Manager bundles state is active.
PASS: ASR Manager SNMP listener is running (SNMP port 162).
PASS: ASR Manager HTTP receiver is running (HTTP port 16161).
PASS: ASR Manager version 23.1.0.
PASS: ASR Manager database connectivity is working.
PASS: ASR Manager Oracle transport endpoint is set correctly. [https://transport.oracle.com]
PASS: ASR Manager site id B156B0E0F8A8AA314F21DFA1BD88046F.
PASS: ASR Manager logging level info.
PASS: ASR Manager process is running as asrmgr.
PASS: ASR Autoupdate bundles state is active.
FAIL: ASR Manager missing registration id.
Please refer to ASR documentation for troubleshooting steps.
It’s now OK, my ASR manager is running with the correct version. I can now configure it with odacli configure-asr: my ODA will then be able to open a Service Request as soon as a hardware failure is detected.
ConclusionIn normal conditions, ASR manager is updated without any issue when appyling the system patch. But if you’re stuck with an old version, you can easily upgrade it manually without any problem.
L’article ODA patching: ASR manager stuck to old version est apparu en premier sur dbi Blog.
REKEY operation on Oracle Database configured with Oracle Key Vault
When Oracle database is configured with Oracle Key Vault, all mater encryption key (MEK) are stored on Oracle Key Vault server.
Rekey is the operation of changing the MEK.
In the previous article Clone Oracle Database configured with Oracle Key Vault (OKV) I cloned a database CDB01 to CDB02 configured with OKV. At the end of the clone process the cloned database CDB02 use the same keys as the source database. In a production environment this is not an acceptable solution. The cloned CDB02 database (which can be a clone for test purpose), need to use it’s own keys. To achieve this goal we need to REKEY the CDB02 database.
First we are going to create a wallet for CDB02.
The we are going execute the REKEY operation, to generate new master encryption keys.
At the end to make the full separation between CDB01 and CDB02 we remove the rights for CDB02 to read the wallet of CDB01.
As explained in the previous post, the RESTFul api is installed in /home/oracle/okv
I use a script to set the RESTFul API environnement:
[oracle@db okv]$ cat /home/oracle/okv/set_okv_rest_env.sh
export OKV_RESTCLI_CONFIG=$HOME/okv/conf
export JAVA_HOME=/usr/java/jdk-11.0.10
export OKV_HOME=$HOME/okv
export PATH=$PATH:$OKV_HOME/bin

[oracle@db okv]$ source /home/oracle/okv/set_okv_rest_env.sh
I use an SQL script to output the wallet status:
[oracle@db okv]$ cat $HOME/tde.sql
set pages 200
set line 300
col WRL_PARAMETER format a50
col status forma a10
col pdb_name  format a20
select pdb_id, pdb_name, guid from dba_pdbs;
select * from v$encryption_wallet where con_id != 2;
[oracle@db ~]$ . oraenv <<< CDB02
[CDB02][oracle@db ~]$ sqlplus / as sysdba

SQL> show parameter wallet_root

NAME				     TYPE	 VALUE
------------------------------------ ----------- ------------------------------
wallet_root			     string	 /opt/oracle/admin/CDB02/wallet

SQL> show parameter tde_configuration

NAME				     TYPE	 VALUE
------------------------------------ ----------- ------------------------------
tde_configuration		     string	 KEYSTORE_CONFIGURATION=OKV|FIL

SQL> @tde.sql

    PDB_ID PDB_NAME		GUID
---------- -------------------- --------------------------------
	 3 PDB01		0AE3AEC4EE5ACDB1E063A001A8ACB8BB
	 2 PDB$SEED		0AE38C7FF01EC651E063A001A8AC821E


WRL_TYPE  WRL_PARAMETER                       STATUS              WALLET_TYPE   WALLET_OR KEYSTORE FULLY_BAC CON_ID
-------- ----------------------------------- -------------------- ------------- --------- -------- --------- -------
FILE     /opt/oracle/admin/CDB02/wallet/tde/ OPEN_NO_MASTER_KEY    AUTOLOGIN    SINGLE      NONE     UNDEFINED  1
OKV                                          OPEN                  OKV          SINGLE      NONE     UNDEFINED  1
FILE                                         OPEN_NO_MASTER_KEY    AUTOLOGIN    SINGLE      UNITED   UNDEFINED  3
OKV                                          OPEN_UNKNONW_         OKV          SINGLE      UNITED   UNDEFINED  3

SQL> exit;

[CDB02][oracle@db ~]$ /opt/oracle/admin/CDB02/wallet/okv/bin/okvutil list
Enter Oracle Key Vault endpoint password: endpoint_password
Unique ID                               Type            Identifier
600D0743-01D9-4F2F-BF6F-C9E8AC74FF2A	Symmetric Key	TDE Master Encryption Key: TAG CDB:CDB01 MEK first
6A752388-F93D-4F14-BF35-39E674CAAFED	Symmetric Key	TDE Master Encryption Key: TAG REKEY CDB01
AB294686-1FC4-4FE8-BFAD-F56BAD0A124B	Symmetric Key	TDE Master Encryption Key: TAG REKEY CDB01
BB0CC77A-10AD-4F55-BF0A-9F5A4C7F98C1	Symmetric Key	TDE Master Encryption Key: TAG CDB:DBTDEOKV:PDB1 MEK first
[CDB02][oracle@db json]$ $OKV_HOME/bin/okv manage-access wallet create --generate-json-input > create_db_wallet_CDB02.json
[CDB02][oracle@db json]$ cat create_db_wallet_CDB02.json
{
  "service" : {
    "category" : "manage-access",
    "resource" : "wallet",
    "action" : "create",
    "options" : {
      "wallet" : "ORA_CLONES",
      "type" : "GENERAL",
      "description" : "Wallet for Oracle Clones"
    }
  }
}

[CDB02][oracle@db json]$ $OKV_HOME/bin/okv manage-access wallet create --from-json create_db_wallet_CDB02.json
{
  "result" : "Success"
}
Set the default wallet for CDB02
[CDB02][oracle@db json]$ okv manage-access wallet set-default --generate-json-input > set_default_wallet_CDB02.json


[CDB02][oracle@db json]$ cat set_default_wallet_CDB02.json
{
  "service" : {
    "category" : "manage-access",
    "resource" : "wallet",
    "action" : "set-default",
    "options" : {
      "wallet" : "ORA_CLONES",
      "endpoint" : "DB_CDB02",
      "unique" : "FALSE"
    }
  }
}

[CDB02][oracle@db json]$ okv manage-access wallet set-default --from-json set_default_wallet_CDB02.json
{
  "result" : "Success"
}

# test
[CDB02][oracle@db json]$ $OKV_HOME/bin/okv manage-access wallet get-default --endpoint DB_CDB02
{
  "result" : "Success",
  "value" : {
    "defaultWallet" : "ORA_CLONES"
  }
}

# list wallets access for endpoint DB_CDB02
[CDB02][oracle@db json]$ $OKV_HOME/bin/okv manage-access wallet list-endpoint-wallets --endpoint DB_CDB02
{
  "result" : "Success",
  "value" : {
    "wallets" : [ "ORA_CLONES", "ORA_DB" ]
  }
}
[CDB02][oracle@db json]$ sqlplus / as sysdba

-- list all keys for CDB02
SQL> set line 200
SQL> col key_id format a40;
SQL> select KEY_ID, KEYSTORE_TYPE,CREATION_TIME from V$ENCRYPTION_KEYS;

KEY_ID                                   KEYSTORE_TYPE	   CREATION_TIME
---------------------------------------- ----------------- ----------------------------
066477563C41354F9ABFFD71C439728D90	 OKV		   12-MAR-24 11.38.29.789446 AM +00:00
06389A1CCF31E64F17BFC1101D9700F83E	 OKV		   12-MAR-24 11.53.46.361951 AM +00:00
064A92E70C7DBB4FBCBFDE46A9226CFB0A	 OKV		   12-MAR-24 11.53.45.932774 AM +00:00
06FED2B8DA29444F57BF11BB545ED7E60D	 OKV		   12-MAR-24 11.20.59.949238 AM +00:00

SQL> ADMINISTER KEY MANAGEMENT SET ENCRYPTION KEY FORCE KEYSTORE IDENTIFIED BY "endpoint_password" container=all;
Remove access from CDB01 wallet:
[CDB02][oracle@db json]$ $OKV_HOME/bin/okv manage-access wallet remove-access --generate-json-input > remove_access_walet_CDB02.json

[CDB02][oracle@db json]$ cat remove_access_walet_CDB02.json
{
  "service" : {
    "category" : "manage-access",
    "resource" : "wallet",
    "action" : "remove-access",
    "options" : {
      "wallet" : "ORA_DB",
      "endpoint" : "DB_CDB02"
    }
  }
}

[CDB02][oracle@db json]$ $OKV_HOME/bin/okv manage-access wallet remove-access --from-json remove_access_walet_CDB02.json
{
  "result" : "Success"
}

[CDB02][oracle@db json]$ /opt/oracle/admin/CDB02/wallet/okv/bin/okvutil list
Enter Oracle Key Vault endpoint password:
Unique ID                               Type            Identifier
1B382343-A786-4F26-BFF9-35A8329A327C	Symmetric Key	TDE Master Encryption Key: MKID 0612F89A18C7984F27BF571A0420C58025
52B62409-6E8D-4F6F-BF08-F7DD73EC1938	Symmetric Key	TDE Master Encryption Key: MKID 06A9FD621A85A74F46BFD88BEB6082B9EB
2DE4025E-CF35-454D-9F60-33640DAAC067	Template	Default template for DB_CDB02

-- restart CDB02 to test if the database open withouth any issue
SQL> startup force

SQL> @$HOME/tde.sql

    PDB_ID PDB_NAME		GUID
---------- -------------------- --------------------------------
	 3 PDB01		0AE3AEC4EE5ACDB1E063A001A8ACB8BB
	 2 PDB$SEED		0AE38C7FF01EC651E063A001A8AC821E


WRL_TYPE    WRL_PARAMETER                       STATUS             WALLET_TYPE WALLET_OR KEYSTORE FULLY_BAC     CON_ID
----------- ----------------------------------- ------------------ ----------- --------- -------- --------- ----------
FILE        /opt/oracle/admin/CDB02/wallet/tde/ OPEN_NO_MASTER_KEY AUTOLOGIN   SINGLE      NONE       UNDEFINED          1
OKV                                             OPEN               OKV         SINGLE      NONE       UNDEFINED          1
FILE                                            OPEN_NO_MASTER_KEY AUTOLOGIN   SINGLE      UNITED     UNDEFINED          3
OKV                                             OPEN               OKV         SINGLE      NONE       UNDEFINED          3
Database CDB02 open correctly.
List the accessible keys for CDB02:
[CDB02][oracle@db json]$ /opt/oracle/admin/CDB02/wallet/okv/bin/okvutil list
Enter Oracle Key Vault endpoint password:
Unique ID                               Type            Identifier
1B382343-A786-4F26-BFF9-35A8329A327C	Symmetric Key	TDE Master Encryption Key: MKID 0612F89A18C7984F27BF571A0420C58025
2DE4025E-CF35-454D-9F60-33640DAAC067	Template	Default template for DB_CDB02
List the wallets accessible for CDB02:
[CDB02][oracle@db json]$ $OKV_HOME/bin/okv manage-access wallet list-endpoint-wallets --endpoint DB_CDB02
{
  "result" : "Success",
  "value" : {
    "wallets" : [ "ORA_CLONES" ]
  }
}
CDB02 has no more access to the CD01 wallet.
ConclusionIf the database is not configured with OKV, after a REKEY operation the wallet file, stored on local disk, must be saved. When the database is configured with OKV when a REKEY operation is issued we have to do …. nothing. The keys are automatically stored in OKV database without any intervention. Just only one remark. The endpoint, in our example DB_CDB02, need to have a default wallet configured. Otherwise the keys will not belongs to any wallet. That doesn’t mean that the CDB02 database cannot access them, but having keys outside wallets in OKV, increase the maintenance operations.
L’article REKEY operation on Oracle Database configured with Oracle Key Vault est apparu en premier sur dbi Blog.
Enhance Containers Security – Prevent Encrypted Data Exfiltration with NeuVector
In my previous blog post we have seen how NeuVector from SUSE can detect and prevent data exfiltration. We used the DLP (Data Loss Prevention) feature of NeuVector to recognize patterns in our HTTP packet. That was great but what could you do when the traffic is not in clear text but encrypted with HTTPS instead? I ended my previous blog saying that we would then need to apply a different security strategy. Let’s find out what we can do and how NeuVector can help with that.
 Application Baseline
Before deploying a new containerized application in production, you have to assess it first. From the security point of view it means you have to learn what processes are running in this container and what are the network connections to and from it.
This observability phase will help you define what is the normal behaviour of your application. That will be your baseline.
A good practice is to deploy first your application in a dev or test environment. Here you can do your assessment in a controlled environment. NeuVector can easily help you with this task as we can see in the picture below:
We can see all the processes that are currently running in the application’s container.
To exfiltrate data you will also need a connection to an external website or server that is under the control of the attacker. With NeuVector we can see all the connections related to this container as shown below:
We can see this container connects to the coredns pod of our cluster and has one external connection with a server outside of our cluster.
We can get more information on this external server by looking at the network map and click on that connection:

All these information are key to your security strategy again encrypted data exfiltration. There are several ways to exfiltrate data but all involve running a process in that container. If it is not a malware, it could be a simple SSH or a curl command. As a security good practice, these tools shouldn’t be available in your application’s container. You have to reduce the possibility of attacks and exploitation to the minimum.
Also data exfiltration requires a connection to an external server. As the traffic is encrypted, you will not get an alert and can’t use DLP. However, you’ll see an abnormal external connection for your application.
It is then paramount to create a baseline of your application and investigate everything that is a drift from it.
Zero Trust Architecture for encrypted data exfiltrationBasically zero trust means you don’t trust anything or anybody. In our topic about encrypted data exfiltration, it means we don’t trust any behaviour that is not part of the normal behaviour of our application (our baseline).
NeuVector can help us with that too. Once we are confident, we have learned all the normal behaviour of our application, we are ready to move it to production. Here we can monitor any drift from our baseline as shown below:

We switch the mode for this container from Discover to Monitor. By default Zero drift is set which means we will now log any new behaviour that is unknown. We can see this new mode for our container below:
Let’s now see how we could detect an encrypted data exfiltration by looking at the “Network Activity” map:

In addition to our normal external connection, we see another one using port 443 (HTTPS). This is a drift from our baseline and you’ll have to investigate it. We can check the security events to learn more about it:

We can first see an alert about a curl process that is not part of the processes we have identified as normal in our baseline. NeuVector logs it as a process profile rule violation. We then see another violation, this one is related to our networking rules. There is an implicit deny rule for any traffic that is not what has been discovered by NeuVector (in our baseline). Setting our container in monitoring mode will not stop that traffic, it will log these drifts as security events and we have then to investigate.
With these 2 informations we have a high probability that our container has been compromised. We can’t say if it is data exfiltration or something else, you can just see a process in your container is connecting to an unknown external server. Note that even if it connects just once, it will be captured by NeuVector. So even stealthy connections will be detected.
At this stage, you have to investigate to discard a false positive alert. Maybe somebody did some tests with that container to check connectivity for example. Once you are confident this is abnormal, you can take some actions to stop this abnormal behavior. To do so we switch our container into “Protect” mode to block any drift. You can do that directly from the map as shown below:
From this point NeuVector will block any network traffic or process that is not part of our baseline.
Wrap upCongratulations! We have detected and protected our container and indirectly our cluster by applying a zero trust security strategy. As the traffic is encrypted we can’t see what it is and can’t tell it is precisely data exfiltration. However we have identified its operating pattern and were able to block it. From there you can investigate deeper how this container has been compromised by checking the logs, reviewing the accesses and the roles in your cluster.
Note that this zero trust strategy allows you to defeat not only encrypted data exfiltration but any unknown attack as well. It is a very effective strategy and we recommend you to deploy it in your Kubernetes cluster as a best practice. Stay safe!
L’article Enhance Containers Security – Prevent Encrypted Data Exfiltration with NeuVector est apparu en premier sur dbi Blog.
ODA X10 lineup now supports Standard Edition 2
6 months ago, Oracle introduced the new Oracle Database Appliance X10 lineup. The biggest surprise came from the supported editions: these new ODAs were Enterprise Edition only! This was because Standard Edition 2 license conditions were not compatible with AMD Epyc processors inside X10 servers. Each AMD Epyc processor is physically equivalent to a 4-socket processor package unlike Intel processors. And as you may know, Standard Edition 2 is limited to a 2-socket configuration at best. So what’s new 6 months later?
Did ODA support Standard Edition from the very beginning?The ODA is on the market since 2011, and the 4 first generations were Enterprise Edition only appliances. These first ODAs were 2-nodes only, like HA now, and dedicated to RAC clusters, solving complexity issues DBAs encountered when deploying RAC on normal servers. RAC was a very popular option at this time.
It’s only starting from 2016 with the introduction of X6-2 lineup and the lite ODAs (S/M/L single node models) that Standard Edition was then allowed. Previously, starting price of an ODA configuration was the HA ODA itself plus an Enterprise Edition processor license, for something around 90.000$, as far as I remember. A lite ODA and a Standard Edition processor license lowered the base price to something less than 40’000$.
This is no coincidence that ODA started to become very popular among clients who were not able to afford this solution before. Remember that ODA’s catchwords are: simple, reliable, affordable. This definitely makes sense starting from 2016.
Oracle Database Appliance and Standard Edition 2Standard Edition 2 and ODA S/L is a great combination for a lot of needs.
If your databases are rather small, if you can easily plan maintenance windows and if you don’t need extra options limited to Enterprise Edition, Standard Edition 2 is a real bargain. Mostly because it’s not expensive whereas it shares the same binaries as Enterprise Edition. Actually, Standard Edition 2 is just an Enterprise Edition with some disabled features. You will not be able to use parallelism for example, and some maintenance tasks are not possible online. There is no Data Guard but you can buy Dbvisit Standby instead. And it’s OK for a lot of databases.
ODA is still a great system in 2024: with Epyc processors, plenty of RAM, NVMe disks and a smart sofware bundle. I would recommend S or L ODAs, as HA is more adequate when using Enterprise Edition.
Associating ODA S/L and Standard Edition 2 makes a powerfull database setup with an affordable price tag. At dbi services, we have a lot of clients using this kind of configuration. ODA and Standard Edition 2 is the perfect match.
What’s new regarding SE2 support on ODA X10?First, documentation has been updated according to this “new” compatibility.
ODA X10 means plenty of CPU resources. When using Enterprise Edition, clients are used to license only a small number of cores. For Standard Edition, clients were used to license sockets, meaning having all the cores available. It’s not true anymore with ODA X10. Starting from 19.22 (the current ODA patch bundle), you will need 1 Standard Edition 2 license for 8 enabled cores on a node. The core reduction (odacli modify-cpucore) must now be applied according to the number of Standard Edition 2 licenses you want to enable.
Here are the SE2 license configuration for each ODA:
ODANb of SE2 PROC licensesNb of coresX10-S1, 2, 3, 48, 16, 24, 32X10-L1, 2, 3, 4, 5, 6, 7, 88, 16, 24, 32, 40, 48, 56, 64X10-HA2, 4, 6, 8, 10, 12, 14, 162×8, 2×16, 2×24, 2×32, 2×40, 2×48, 2×56, 2×64Regarding HA, it should be possible to deploy databases on one node only using single instance databases, meaning all the cores on one node only. But both nodes will have the same number of cores, and one node will not be used for databases. Not sure if it’s the best configuration.
Is it better or worse than before?First, these new conditions only apply to X10 lineup. If you’re still using X9 and prior ODAs, nothing changed.
You could see that using more cores will cost more, and it’s true. But a 8-core ODA is already a very capable machine. It will also make the ODA X10-L even more appealling compared to X10-S: only one PROC license is now required for minimal needs but with the possibility of adding disks later. It’s definitely a more secure choice as you will keep your ODA for 5 to 7 years. Nobody really knows what will be your database needs beyond 3 years.
Let’s talk about pricing: ODA X10 and SE2The X10-S is an entry price point for a small number of small databases. Most of S ODAs are for using Standard Edition 2 databases.
The X10-L is much more capable with 2 CPUs and twice the RAM size, and the most important thing is that it can get disk expansions. This is the best ODA in the lineup and the most popular among our customers.
The X10-HA is normally for RAC users (High Availability). The disk capacity is much higher than single node models, and HDDs are still an option if SSDs capacity is not enough (High Capacity vs. High Performance versions). With X10-HA, big infrastructures can be consolidated with a very small number of HA ODAs. But does it make sense with Standard Edition 2? Not in my opinion.
ModelnodesURAM GBmax RAM GBRAW TBmax RAW TBODA base priceMin SE2 license priceMax SE2 license priceODA X10-S1225676813.613.621’579$17’500$70’000$ODA X10-L12512153613.654.434’992$17’500$140’000$ODA X10-HA HP28/122×5122×15364636897’723$35’000$280’000$ODA X10-HA HC28/122×5122×153639079297’723$35’000$280’000$Prices are from the latest Technology and Exadata price lists (1st and 8th of March, 2024).
Does it make sense to order X9-2 models instead of X10?X9-2 lineup still being available, one could ask which is the best one. X10 is a brand new system with AMD Epyc supposed to be more powerfull compared to X9-2. As having less cores but running at higher speed is better when using Standard Edition 2, X10 has the advantage. The only thing that could make the difference is on the storage side: X10-L is limited to 8x 6.8TB disks, meaning 54.4TB RAW. X9-2L can have up to 12x 6.8TB disks, meaning 81.6TB. It’s not really enough to justify buying an old X9-2L. Maximum storage capacity is normally not an issue among Standard Edition 2 users. Furthermore, X10 is not so new anymore, meaning that you won’t be an early adopter if you buy one.
ConclusionODA X10 and Standard Edition 2 is a great combination again. The new licensing rules are quite a normal move regarding the CPU specs of X10 ODAs. Capacity On Demand, which made the success of the ODA lineup, is now also a reality for Standard Edition users and it’s OK.
L’article ODA X10 lineup now supports Standard Edition 2 est apparu en premier sur dbi Blog.
ZDM Physical Online Migration – A success story
I have been recently blogging about ZDM Physical Online Migration where I was explaining this migration method and preparing customer On-Premises to ExaCC migration. See my blog, https://www.dbi-services.com/blog/physical-online-migration-to-exacc-with-oracle-zero-downtime-migration-zdm/. I have now had the opportunity to migrate customer database and would like to share, in this blog, this success story.
Read more: ZDM Physical Online Migration – A success story ClarificationsFirst of all, I would encourage you to read the previous mentioned blog to understand the requirements, the preparation steps, the migration steps and the parameters used during ZDM Physical Online Migration. This blog is not intended to reexplain the same information already presented in the previous one, but just to show in detail the success story of the migration, and how the migration has been performed.
Compared to the previous migration preparation, detailed in previous blog, there are 3 parameters that we are not going to finally activate:
- SKIP_FALLBACK: In fact, even in this migration method, there is no real fallback possible, and if a real fallback is needed, it will have to be put in place by the user. When I’m talking about fallback, I think about having customer the possibility after a few days of using the new environment in production to switch back to the previous on-premises environment, in case there is, for example, any performance problem. In our case here, with ZDM migration, it will anyhow not be possible, knowing we are converting the non-cdb on-premises database to a pdb database on the new ExaCC. Building a Data Guard environment between a non-cdb and a cdb environment is in any case not possible. In our case, we did some dry run, giving customer the possibility to test the new ExaCC environment before the migration, to ensure all is ok, performance wise and so on. In our procedure, we will include a fallback, but this fallback will give the possibility to activate again the on-premises database in case the application tests is not successful after the migration and before putting the new PDB on the ExaCC in production.
- TGT_RETAIN_DB_UNIQUE_NAME: This is in fact a legacy parameter that was mandatory for the first generation of the ExaCC, because the platform was setting db_unique_name the same as dbname. This parameter is now not needed any more and is deprecated.
- TGT_SKIP_DATAPATCH: We faced several bugs having the source database in 19.10 or 19.16. We have then decided to patch the on-premises source database to the same last version as running on the ExaCC, that is to say 19.22. In this case, we do not need this datapatch steps, and we will then set this one to true value, in order to skip it.
Finally, I would like to recall that I have anonymised all outputs to remove customer infrastructure names. So let’s take the same previous convention :
ExaCC Cluster 01 node 01 : ExaCC-cl01n1
ExaCC Cluster 01 node 02 : ExaCC-cl01n2
On premises Source Host : vmonpr
Target db_unique_name on the ExaCC : ONPR_RZ2
Database Name to migrate : ONPR
ZDM Host : zdmhost
ZDM user : zdmuser
Domain : domain.com
ExaCC PDB to migrate to : ONPRZ_APP_001T
The on-premise database is a single-tenant (non-cdb) database running version 19.22.
The target database is an Oracle RAC database running on ExaCC with Oracle version 19.22.
The Oracle Net port used on the on-premise site is 13000 and the Oracle Net port used on the ExaCC is 1521.
We will use ZDM to migrate the on-premise single-tenant database, to a PDB within a CDB. ZDM will then be in charge of migrating the database to the exacc using Data Guard, convert non-cdb database to pdb within a target cdb, upgrade Time Zone. The creation of the standby database will be done through a direct connection. Without any backup.
We will then migrate on-premises Single-Tenant database, named ONPR, to a PDB on the ExaCC. The PDB will be named ONPRZ_APP_001T.
It is also mandatory to have a valid backup of the source database, before we start the migration in the maintenance windows, in case we are having any issue during fallback. In any case it is always mandatory for any migration, patch or upgrade to have a valid backup of the production database.
ZDM patch versionWe were initially using 21.1.4.0.0 ZDM version:
[zdmuser@zdmhost migration]$ /u01/app/oracle/product/zdm/bin/zdmcli -build
version: 21.0.0.0.0
full version: 21.4.0.0.0
patch version: 21.4.1.0.0
label date: 221207.25
ZDM kit build date: Jul 31 2023 14:24:25 UTC
CPAT build version: 23.7.0
But we faced a major bug, where ZDM was incorrectly exporting database master key into the new ExaCC wallet. The migration was failing with following error once ZDM was trying to open the new created PDB: ALTER PLUGGABLE DATABASE OPEN
*
ERROR at line 1:
ORA-28374: typed master key not found in wallet
Checking the masterkeyid from v$database_key_info, and the recorded key in the keystore, I could confirm that on the source, the database master key was correctly recorded in the keystore, but not on the target side. This was later confirmed to be a ZDM bug solved in last patch: 21.4.5.0.0 that was just released.
We patched ZDM software on the ZDM host, and are now running following version:
[zdmuser@zdmhost migration]$ /u01/app/oracle/product/zdm/bin/zdmcli -build
version: 21.0.0.0.0
full version: 21.4.0.0.0
patch version: 21.4.5.0.0
label date: 221207.30
ZDM kit build date: Mar 21 2024 22:07:12 UTC
CPAT build version: 23.12.0
As we can see later in the blog, this new version is bringing some new bugs that we can easily workaround.
Prepare ZDM response fileWe have been configuring accordingly following parameters in the response file. For any explanation of used parameter, read my previous mentioned article.
[zdmuser@zdmhost migration]$ vi zdm_ONPR_physical_online.rsp

[zdmuser@zdmhost migration]$ diff zdm_ONPR_physical_online.rsp /u01/app/oracle/product/zdm/rhp/zdm/template/zdm_template.rsp
24c24
< TGT_DB_UNIQUE_NAME=ONPR_RZ2
---
> TGT_DB_UNIQUE_NAME=
32c32
< MIGRATION_METHOD=ONLINE_PHYSICAL
---
> MIGRATION_METHOD=
63c63
< DATA_TRANSFER_MEDIUM=DIRECT
---
> DATA_TRANSFER_MEDIUM=
75c75
< PLATFORM_TYPE=EXACC
---
> PLATFORM_TYPE=
119c119
< SRC_DB_LISTENER_PORT=13000
---
> SRC_DB_LISTENER_PORT=
230c230
< NONCDBTOPDB_CONVERSION=TRUE
---
> NONCDBTOPDB_CONVERSION=FALSE
252c252
< SKIP_FALLBACK=TRUE
---
> SKIP_FALLBACK=
268c268
< TGT_RETAIN_DB_UNIQUE_NAME=FALSE
---
> TGT_RETAIN_DB_UNIQUE_NAME=
279c279
< TGT_SKIP_DATAPATCH=TRUE
---
> TGT_SKIP_DATAPATCH=FALSE
312c312
< SHUTDOWN_SRC=FALSE
---
> SHUTDOWN_SRC=
333c333
< SRC_RMAN_CHANNELS=2
---
> SRC_RMAN_CHANNELS=
340c340
< TGT_RMAN_CHANNELS=2
---
> TGT_RMAN_CHANNELS=
526c526
< ZDM_USE_DG_BROKER=TRUE
---
> ZDM_USE_DG_BROKER=
574c574
< ZDM_NONCDBTOPDB_PDB_NAME=ONPRZ_APP_001T
---
> ZDM_NONCDBTOPDB_PDB_NAME=
595c595
< ZDM_TGT_UPGRADE_TIMEZONE=TRUE
---
> ZDM_TGT_UPGRADE_TIMEZONE=FALSE
Passwordless Login
See my previous blogs for more information about this subject. It is mandatory for ZDM to have passwordless login configured between ZDM host and the source and target nodes.
For both ExaCC nodes, it was already done:
[zdmuser@zdmhost migration]$ ssh opc@ExaCC-cl01n1
Last login: Wed Mar 20 10:44:09 2024 from 10.160.52.122
[opc@ExaCC-cl01n1 ~]$

[zdmuser@zdmhost migration]$ ssh opc@ExaCC-cl01n2
Last login: Wed Mar 20 10:32:33 2024 from 10.160.52.122
[opc@ExaCC-cl01n2 ~]$
For new on-premises database, we configured it with the source node, adding the id_rsa.pub content from the ZDM host to the authorized_keys on the source:
[zdmuser@zdmhost .ssh]$ cat id_rsa.pub
ssh-rsa AAAAB3**************************3CW20= zdmuser@zdmhost
[zdmuser@zdmhost .ssh]$

oracle@vmonpr:/home/oracle/.ssh/ [ONPR] echo "ssh-rsa AAAAB3*******************3CW20= zdmuser@zdmhost" >> authorized_keys
Checking, it is working as expected:
[zdmuser@zdmhost .ssh]$ ssh oracle@vmonpr
Last login: Wed Mar 20 11:33:46 2024
oracle@vmonpr:/home/oracle/ [RDBMS12201_EE_190716]
Create target database on the ExaCC
As explained in the requirements and my other blog articles, we must create a target CDB on the ExaCC with same DB_NAME as the source database to be migrated but other DB_UNIQUE_NAME. In our case it will be ONPR for the DB_NAME and ONPR_RZ2 for the DB_UNIQUE_NAME. This database must exist before the migration is started with ZDM. ZDM will create another temporary database taking the final PDB name and will use this target CDB as a template.
Convert ExaCC target database to single instanceThe target database on the ExaCC is a RAC database with 2 hosts. So we have got 2 instances for the same database. We therefore have 2 UNDO tablespaces. The on-premises database is a single instance one, so having currently only 1 UNDO tablespace. In order to avoid ZDM to create an additional UNDO tablespace on the on-premises single instance database, we will convert the target database from RAC to single instance.
We will first update cluster_database instance parameter to false value.
SQL> select inst_id, name, value from gv$parameter where lower(name)='cluster_database';

   INST_ID NAME                 VALUE
---------- -------------------- ---------------
         2 cluster_database     TRUE
         1 cluster_database     TRUE

SQL> alter system set cluster_database=FALSE scope=spfile sid='*';

System altered.
We will stop the target database:
oracle@ExaCC-cl01n1:~/ [ONPR1 (CDB$ROOT)] srvctl status database -d ONPR_RZ2
Instance ONPR1 is running on node ExaCC-cl01n1
Instance ONPR2 is running on node ExaCC-cl01n2

oracle@ExaCC-cl01n1:~/ [ONPR1 (CDB$ROOT)] srvctl stop database -d ONPR_RZ2

oracle@ExaCC-cl01n1:~/ [ONPR1 (CDB$ROOT)] srvctl status database -d ONPR_RZ2
Instance ONPR1 is not running on node ExaCC-cl01n1
Instance ONPR2 is not running on node ExaCC-cl01n2
And remove the second node from the grid infra configuration:
oracle@ExaCC-cl01n1:~/ [ONPR1 (CDB$ROOT)] srvctl remove instance -d ONPR_RZ2 -i ONPR2
Remove instance from the database ONPR_RZ2? (y/[n]) y
And restart the database:
oracle@ExaCC-cl01n1:~/ [ONPR1 (CDB$ROOT)] srvctl start database -d ONPR_RZ2

oracle@ExaCC-cl01n1:~/ [ONPR1 (CDB$ROOT)] srvctl status database -d ONPR_RZ2
Instance ONPR1 is running on node ExaCC-cl01n1
We can also check with gv$parameter and see we only have one running instance:
oracle@ExaCC-cl01n1:~/ [ONPR1 (CDB$ROOT)] sqh

SQL*Plus: Release 19.0.0.0.0 - Production on Wed Mar 20 10:51:33 2024
Version 19.22.0.0.0

Copyright (c) 1982, 2023, Oracle.  All rights reserved.


Connected to:
Oracle Database 19c EE Extreme Perf Release 19.0.0.0.0 - Production
Version 19.22.0.0.0

SQL> select inst_id, name, value from gv$parameter where lower(name)='cluster_database';

   INST_ID NAME                 VALUE
---------- -------------------- ---------------
         1 cluster_database     FALSE
Configure Transparent Data Encyption (TDE) on the source database
See my previous blog for detailed explanation.
SQL> !ls /u00/app/oracle/admin/ONPR/wallet
ls: cannot access /u00/app/oracle/admin/ONPR/wallet: No such file or directory

SQL> !mkdir /u00/app/oracle/admin/ONPR/wallet

SQL> !ls /u00/app/oracle/admin/ONPR/wallet

SQL> alter system set WALLET_ROOT='/u00/app/oracle/admin/ONPR/wallet' scope=spfile;

System altered.

SQL> shutdown immediate
Database closed.
Database dismounted.
ORACLE instance shut down.

SQL> startup
ORACLE instance started.

Total System Global Area 2147479664 bytes
Fixed Size                  8941680 bytes
Variable Size            1224736768 bytes
Database Buffers          905969664 bytes
Redo Buffers                7831552 bytes
Database mounted.
Database opened.

SQL> select WRL_PARAMETER, WRL_TYPE,WALLET_TYPE, status from V$ENCRYPTION_WALLET;

WRL_PARAMETER                  WRL_TYPE             WALLET_TYPE          STATUS
------------------------------ -------------------- -------------------- ------------------------------
                               FILE                 UNKNOWN              NOT_AVAILABLE

SQL> alter system set tde_configuration='keystore_configuration=FILE' scope=both;

System altered.

SQL> select WRL_PARAMETER, WRL_TYPE,WALLET_TYPE, status from V$ENCRYPTION_WALLET;

WRL_PARAMETER                                      WRL_TYPE             WALLET_TYPE          STATUS
-------------------------------------------------- -------------------- -------------------- ------------------------------
/u00/app/oracle/admin/ONPR/wallet/tde/             FILE                 UNKNOWN              NOT_AVAILABLE

SQL> ADMINISTER KEY MANAGEMENT CREATE KEYSTORE IDENTIFIED BY "*****************";

keystore altered.

SQL> !ls -ltrh /u00/app/oracle/admin/ONPR/wallet/tde
total 4.0K
-rw-------. 1 oracle dba 2.5K Mar 20 11:11 ewallet.p12

SQL> select WRL_PARAMETER, WRL_TYPE,WALLET_TYPE, status from V$ENCRYPTION_WALLET;

WRL_PARAMETER                                      WRL_TYPE             WALLET_TYPE          STATUS
-------------------------------------------------- -------------------- -------------------- ------------------------------
/u00/app/oracle/admin/ONPR/wallet/tde/             FILE                 UNKNOWN              CLOSED

SQL> ADMINISTER KEY MANAGEMENT SET KEYSTORE OPEN IDENTIFIED BY "*****************";

keystore altered.

SQL> select WRL_PARAMETER, WRL_TYPE,WALLET_TYPE, status from V$ENCRYPTION_WALLET;

WRL_PARAMETER                                      WRL_TYPE             WALLET_TYPE          STATUS
-------------------------------------------------- -------------------- -------------------- ------------------------------
/u00/app/oracle/admin/ONPR/wallet/tde/             FILE                 PASSWORD             OPEN_NO_MASTER_KEY

SQL> ADMINISTER KEY MANAGEMENT SET KEY IDENTIFIED BY "***************" with backup;

keystore altered.

SQL> !ls -ltrh /u00/app/oracle/admin/ONPR/wallet/tde
total 8.0K
-rw-------. 1 oracle dba 2.5K Mar 20 11:14 ewallet_2024032010143867.p12
-rw-------. 1 oracle dba 3.9K Mar 20 11:14 ewallet.p12

SQL> ADMINISTER KEY MANAGEMENT CREATE AUTO_LOGIN KEYSTORE FROM KEYSTORE '/u00/app/oracle/admin/ONPR/wallet/tde/' IDENTIFIED BY "*****************";

keystore altered.

SQL> ADMINISTER KEY MANAGEMENT SET KEYSTORE CLOSE IDENTIFIED BY "****************";

keystore altered.

SQL> select WRL_PARAMETER, WRL_TYPE,WALLET_TYPE, status from V$ENCRYPTION_WALLET;

WRL_PARAMETER                                      WRL_TYPE             WALLET_TYPE          STATUS
-------------------------------------------------- -------------------- -------------------- ------------------------------
/u00/app/oracle/admin/ONPR/wallet/tde/             FILE                 AUTOLOGIN            OPEN

SQL> !ls -ltrh /u00/app/oracle/admin/ONPR/wallet/tde
total 12K
-rw-------. 1 oracle dba 2.5K Mar 20 11:14 ewallet_2024032010143867.p12
-rw-------. 1 oracle dba 3.9K Mar 20 11:14 ewallet.p12
-rw-------. 1 oracle dba 4.0K Mar 20 11:15 cwallet.sso

SQL> show parameter tablespace_encryption

NAME                                 TYPE        VALUE
------------------------------------ ----------- ------------------------------
tablespace_encryption                string      MANUAL_ENABLE

SQL> alter system set tablespace_encryption='decrypt_only' scope=spfile;

System altered.

SQL> shutdown immediate
Database closed.
Database dismounted.
ORACLE instance shut down.

SQL> startup
ORACLE instance started.

Total System Global Area 2147479664 bytes
Fixed Size                  8941680 bytes
Variable Size            1224736768 bytes
Database Buffers          905969664 bytes
Redo Buffers                7831552 bytes
Database mounted.
Database opened.

SQL> show parameter tablespace_encryption

NAME                                 TYPE        VALUE
------------------------------------ ----------- ------------------------------
tablespace_encryption                string      DECRYPT_ONLY
Update source database SYS password
Source database SYS password should match target one.
SQL> alter user sys identified by "********";

User altered.
Update listener configuration on the source
The source database is not a grid infra one. A static DGMGRL entry is then mandatory for Data Guard to restart old primary during a switchover operation. Unfortunately, ZDM does not configure it on his side.
We will add following entry into the source listener:
SID_LIST_lsr1ONPR =
  (SID_LIST =
    (SID_DESC =
      (GLOBAL_DBNAME = ONPR_DGMGRL.domain.com)
      (ORACLE_HOME = /u00/app/oracle/product/19.22.0.0.240116.EE)
      (SID_NAME = ONPR)
    )
  )
oracle@vmonpr:/u00/app/oracle/product/19.22.0.0.240116.EE/network/admin/ [ONPR] ls -l total 0 lrwxrwxrwx. 1 oracle dba 38 Mar 8 09:46 ldap.ora -> /u00/app/oracle/network/admin/ldap.ora lrwxrwxrwx. 1 oracle dba 45 Mar 8 09:46 listener.ora -> /u00/app/oracle/network/admin/listenerV12.ora lrwxrwxrwx. 1 oracle dba 40 Mar 8 10:50 sqlnet.ora -> /u00/app/oracle/network/admin/sqlnet.ora lrwxrwxrwx. 1 oracle dba 42 Mar 8 09:46 tnsnames.ora -> /u00/app/oracle/network/admin/tnsnames.ora oracle@vmonpr:/u00/app/oracle/network/admin/ [ONPR] cp -p listenerV12.ora listenerV12.ora.bak.20240320 oracle@vmonpr:/u00/app/oracle/network/admin/ [ONPR] vil oracle@vmonpr:/u00/app/oracle/network/admin/ [ONPR] diff listenerV12.ora listenerV12.ora.bak.20240320 85,94d84 < # For ZDM Migration < SID_LIST_lsr1ONPR = < (SID_LIST = < (SID_DESC = < (GLOBAL_DBNAME = ONPR_DGMGRL.domain.com) < (ORACLE_HOME = /u00/app/oracle/product/19.22.0.0.240116.EE) < (SID_NAME = ONPR) < ) < ) < oracle@vmonpr:/u00/app/oracle/network/admin/ [ONPR] lsnrctl reload lsr1ONPR LSNRCTL for Linux: Version 19.0.0.0.0 - Production on 20-MAR-2024 14:15:41 Copyright (c) 1991, 2023, Oracle. All rights reserved. Connecting to (DESCRIPTION=(ADDRESS=(PROTOCOL=TCP)(HOST=vmonpr.domain.com)(PORT=13000))) The command completed successfully oracle@vmonpr:/u00/app/oracle/network/admin/ [ONPR] lsnrctl status lsr1ONPR | grep -i dgmgrl Service "ONPR_DGMGRL.domain.com" has 1 instance(s).Archived log
Data Guard is using the REDO vector to synchronise the standby database. It is then mandatory to keep available, during the whole migration process, the archived log files that have not been applied on the standby database.
Checking target spaceWe need to check that there is enough space in the DATA disk group of the ASM at the ExaCC side.
[grid@ExaCC-cl01n1 ~]$ asmcmd

ASMCMD> lsdg
State    Type  Rebal  Sector  Logical_Sector  Block       AU   Total_MB    Free_MB  Req_mir_free_MB  Usable_file_MB  Offline_disks  Voting_files  Name
MOUNTED  HIGH  N         512             512   4096  4194304   43409664   16203032                0         5401010              0             Y  DATAC1/
MOUNTED  HIGH  N         512             512   4096  4194304   14469120   13175436                0         4391812              0             N  RECOC1/
MOUNTED  HIGH  N         512             512   4096  4194304  144691200  144688128                0        48229376              0             N  SPRC1/
Run an evaluation of the migration
Before running the migration it is mandatory to test it. This is done by using the option -eval.
[zdmuser@zdmhost migration]$ /u01/app/oracle/product/zdm/bin/zdmcli migrate database -sourcesid ONPR -rsp /home/zdmuser/migration/zdm_ONPR_physical_online.rsp -sourcenode vmonpr -srcauth zdmauth -srcarg1 user:oracle -srcarg2 identity_file:/home/zdmuser/.ssh/id_rsa -srcarg3 sudo_location:/usr/bin/sudo -targetnode ExaCC-cl01n1 -tgtauth zdmauth -tgtarg1 user:opc -tgtarg2 identity_file:/home/zdmuser/.ssh/id_rsa -tgtarg3 sudo_location:/usr/bin/sudo -tdekeystorepasswd -tgttdekeystorepasswd -eval
zdmhost.domain.com: Audit ID: 1138
Enter source database ONPR SYS password:
Enter source database ONPR TDE keystore password:
Enter target container database TDE keystore password:
zdmhost: 2024-03-22T13:04:06.449Z : Processing response file ...
Operation "zdmcli migrate database" scheduled with the job ID "73".
Checking the job we can see that it is in the current status SUCCEEDED and that all precheck phases have been passed successfully.
[zdmuser@zdmhost migration]$ /u01/app/oracle/product/zdm/bin/zdmcli query job -jobid 73
zdmhost.domain.com: Audit ID: 1146
Job ID: 73
User: zdmuser
Client: zdmhost
Job Type: "EVAL"
Scheduled job command: "zdmcli migrate database -sourcesid ONPR -rsp /home/zdmuser/migration/zdm_ONPR_physical_online.rsp -sourcenode vmonpr -srcauth zdmauth -srcarg1 user:oracle -srcarg2 identity_file:/home/zdmuser/.ssh/id_rsa -srcarg3 sudo_location:/usr/bin/sudo -targetnode ExaCC-cl01n1 -tgtauth zdmauth -tgtarg1 user:opc -tgtarg2 identity_file:/home/zdmuser/.ssh/id_rsa -tgtarg3 sudo_location:/usr/bin/sudo -tdekeystorepasswd -tgttdekeystorepasswd -eval"
Scheduled job execution start time: 2024-03-22T14:04:06+01. Equivalent local time: 2024-03-22 14:04:06
Current status: SUCCEEDED
Result file path: "/u01/app/oracle/chkbase/scheduled/job-73-2024-03-22-14:04:13.log"
Metrics file path: "/u01/app/oracle/chkbase/scheduled/job-73-2024-03-22-14:04:13.json"
Job execution start time: 2024-03-22 14:04:13
Job execution end time: 2024-03-22 14:25:20
Job execution elapsed time: 9 minutes 13 seconds
ZDM_GET_SRC_INFO ........... PRECHECK_PASSED
ZDM_GET_TGT_INFO ........... PRECHECK_PASSED
ZDM_PRECHECKS_SRC .......... PRECHECK_PASSED
ZDM_PRECHECKS_TGT .......... PRECHECK_PASSED
ZDM_SETUP_SRC .............. PRECHECK_PASSED
ZDM_SETUP_TGT .............. PRECHECK_PASSED
ZDM_PREUSERACTIONS ......... PRECHECK_PASSED
ZDM_PREUSERACTIONS_TGT ..... PRECHECK_PASSED
ZDM_VALIDATE_SRC ........... PRECHECK_PASSED
ZDM_VALIDATE_TGT ........... PRECHECK_PASSED
ZDM_POSTUSERACTIONS ........ PRECHECK_PASSED
ZDM_POSTUSERACTIONS_TGT .... PRECHECK_PASSED
ZDM_CLEANUP_SRC ............ PRECHECK_PASSED
ZDM_CLEANUP_TGT ............ PRECHECK_PASSED
Run the migration and pause after ZDM_CONFIGURE_DG_SRC phase
We will now start the migration until Data Guard is setup. We will then run the migration and pause it after Data Guard is configured, using the option -pauseafter ZDM_CONFIGURE_DG_SRC.
This will allow us to prepare the migration, have the standby database created on the ExaCC and Data Guard configured with no downtime. We do not need any maintenance window to perform this part of the migration.
[zdmuser@zdmhost migration]$ /u01/app/oracle/product/zdm/bin/zdmcli migrate database -sourcesid ONPR -rsp /home/zdmuser/migration/zdm_ONPR_physical_online.rsp -sourcenode vmonpr -srcauth zdmauth -srcarg1 user:oracle -srcarg2 identity_file:/home/zdmuser/.ssh/id_rsa -srcarg3 sudo_location:/usr/bin/sudo -targetnode ExaCC-cl01n1 -tgtauth zdmauth -tgtarg1 user:opc -tgtarg2 identity_file:/home/zdmuser/.ssh/id_rsa -tgtarg3 sudo_location:/usr/bin/sudo -tdekeystorepasswd -tgttdekeystorepasswd -pauseafter ZDM_CONFIGURE_DG_SRC
zdmhost.domain.com: Audit ID: 1156
Enter source database ONPR SYS password:
Enter source database ONPR TDE keystore password:
Enter target container database TDE keystore password:
zdmhost: 2024-03-22T14:29:56.176Z : Processing response file ...
Operation "zdmcli migrate database" scheduled with the job ID "75".
Checking the job we can see it is failing at the restore phase.
[zdmuser@zdmhost migration]$ /u01/app/oracle/product/zdm/bin/zdmcli query job -jobid 75
zdmhost.domain.com: Audit ID: 1160
Job ID: 75
User: zdmuser
Client: zdmhost
Job Type: "MIGRATE"
Scheduled job command: "zdmcli migrate database -sourcesid ONPR -rsp /home/zdmuser/migration/zdm_ONPR_physical_online.rsp -sourcenode vmonpr -srcauth zdmauth -srcarg1 user:oracle -srcarg2 identity_file:/home/zdmuser/.ssh/id_rsa -srcarg3 sudo_location:/usr/bin/sudo -targetnode ExaCC-cl01n1 -tgtauth zdmauth -tgtarg1 user:opc -tgtarg2 identity_file:/home/zdmuser/.ssh/id_rsa -tgtarg3 sudo_location:/usr/bin/sudo -tdekeystorepasswd -tgttdekeystorepasswd -pauseafter ZDM_CONFIGURE_DG_SRC"
Scheduled job execution start time: 2024-03-22T15:29:56+01. Equivalent local time: 2024-03-22 15:29:56
Current status: FAILED
Result file path: "/u01/app/oracle/chkbase/scheduled/job-75-2024-03-22-15:30:13.log"
Metrics file path: "/u01/app/oracle/chkbase/scheduled/job-75-2024-03-22-15:30:13.json"
Job execution start time: 2024-03-22 15:30:13
Job execution end time: 2024-03-22 15:41:05
Job execution elapsed time: 8 minutes 2 seconds
ZDM_GET_SRC_INFO ................ COMPLETED
ZDM_GET_TGT_INFO ................ COMPLETED
ZDM_PRECHECKS_SRC ............... COMPLETED
ZDM_PRECHECKS_TGT ............... COMPLETED
ZDM_SETUP_SRC ................... COMPLETED
ZDM_SETUP_TGT ................... COMPLETED
ZDM_PREUSERACTIONS .............. COMPLETED
ZDM_PREUSERACTIONS_TGT .......... COMPLETED
ZDM_VALIDATE_SRC ................ COMPLETED
ZDM_VALIDATE_TGT ................ COMPLETED
ZDM_DISCOVER_SRC ................ COMPLETED
ZDM_COPYFILES ................... COMPLETED
ZDM_PREPARE_TGT ................. COMPLETED
ZDM_SETUP_TDE_TGT ............... COMPLETED
ZDM_RESTORE_TGT ................. FAILED
ZDM_RECOVER_TGT ................. PENDING
ZDM_FINALIZE_TGT ................ PENDING
ZDM_CONFIGURE_DG_SRC ............ PENDING
ZDM_SWITCHOVER_SRC .............. PENDING
ZDM_SWITCHOVER_TGT .............. PENDING
ZDM_POST_DATABASE_OPEN_TGT ...... PENDING
ZDM_NONCDBTOPDB_PRECHECK ........ PENDING
ZDM_NONCDBTOPDB_CONVERSION ...... PENDING
ZDM_POST_MIGRATE_TGT ............ PENDING
TIMEZONE_UPGRADE_PREPARE_TGT .... PENDING
TIMEZONE_UPGRADE_TGT ............ PENDING
ZDM_POSTUSERACTIONS ............. PENDING
ZDM_POSTUSERACTIONS_TGT ......... PENDING
ZDM_CLEANUP_SRC ................. PENDING
ZDM_CLEANUP_TGT ................. PENDING

Pause After Phase: "ZDM_CONFIGURE_DG_SRC"
ZDM logs is showing following:
PRGO-4086 : failed to query the "VERSION" details from the view "V$INSTANCE" for database "ONPRZ_APP_001T"
SQL*Plus: Release 19.0.0.0.0 - Production on Fri Mar 22 13:34:55 2024
Version 19.22.0.0.0

Copyright (c) 1982, 2023, Oracle.  All rights reserved.

Connected to an idle instance.

alter session set NLS_LANGUAGE='AMERICAN'
*
ERROR at line 1:
ORA-01034: ORACLE not available
Process ID: 0
Session ID: 0 Serial number: 0
This is due to a new bug on the latest ZDM patch, where ZDM is incorrectly setting audit_trail instance parameter for the temporary instance called ONPRZ_APP_001T (final PDB name). As we can see the parameter is set to EXTENDED, which is absolutely not possible. It is either DB or DB, EXTENDED. EXTENDED alone is not an approrpriate value. This is why the instance can not be started.
SQL> !strings /u02/app/oracle/product/19.0.0.0/dbhome_1/dbs/spfileONPRZ_APP_001T1.ora | grep -i audit_trail
*.audit_trail='EXTENDED'
On the source database, the parameter is set as:
SQL> show parameter audit_trail

NAME                                 TYPE        VALUE
------------------------------------ ----------- ------------------------------
audit_trail                          string      DB, EXTENDED
And on the target database, the parameter is set as:
SQL> show parameter audit_trail

NAME                                 TYPE        VALUE
------------------------------------ ----------- ------------------------------
audit_trail                          string      DB
So we just need to create a pfile from spfile, update it accordingly and set back the spfile from updated pfile.
SQL> create pfile='/tmp/initONPRZ_APP_001T1_prob.ora' from spfile='/u02/app/oracle/product/19.0.0.0/dbhome_1/dbs/spfileONPRZ_APP_001T1.ora';

File created.

SQL> !vi /tmp/initONPRZ_APP_001T1_prob.ora

SQL> !grep -i audit_trail /tmp/initONPRZ_APP_001T1_prob.ora
*.audit_trail='DB','EXTENDED'

SQL> create spfile='/u02/app/oracle/product/19.0.0.0/dbhome_1/dbs/spfileONPRZ_APP_001T1.ora' from pfile='/tmp/initONPRZ_APP_001T1_prob.ora';

File created.
And we will resume ZDM job.
[zdmuser@zdmhost migration]$ /u01/app/oracle/product/zdm/bin/zdmcli resume job -jobid 75
zdmhost.domain.com: Audit ID: 1163
Checking the job, we can see that all phases until switchover have been completed successfully, and the job is in pause status.
[zdmuser@zdmhost migration]$ /u01/app/oracle/product/zdm/bin/zdmcli query job -jobid 75
zdmhost.domain.com: Audit ID: 1164
Job ID: 75
User: zdmuser
Client: zdmhost
Job Type: "MIGRATE"
Scheduled job command: "zdmcli migrate database -sourcesid ONPR -rsp /home/zdmuser/migration/zdm_ONPR_physical_online.rsp -sourcenode vmonpr -srcauth zdmauth -srcarg1 user:oracle -srcarg2 identity_file:/home/zdmuser/.ssh/id_rsa -srcarg3 sudo_location:/usr/bin/sudo -targetnode ExaCC-cl01n1 -tgtauth zdmauth -tgtarg1 user:opc -tgtarg2 identity_file:/home/zdmuser/.ssh/id_rsa -tgtarg3 sudo_location:/usr/bin/sudo -tdekeystorepasswd -tgttdekeystorepasswd -pauseafter ZDM_CONFIGURE_DG_SRC"
Scheduled job execution start time: 2024-03-22T15:29:56+01. Equivalent local time: 2024-03-22 15:29:56
Current status: PAUSED
Current Phase: "ZDM_CONFIGURE_DG_SRC"
Result file path: "/u01/app/oracle/chkbase/scheduled/job-75-2024-03-22-15:30:13.log"
Metrics file path: "/u01/app/oracle/chkbase/scheduled/job-75-2024-03-22-15:30:13.json"
Job execution start time: 2024-03-22 15:30:13
Job execution end time: 2024-03-22 16:32:20
Job execution elapsed time: 19 minutes 44 seconds
ZDM_GET_SRC_INFO ................ COMPLETED
ZDM_GET_TGT_INFO ................ COMPLETED
ZDM_PRECHECKS_SRC ............... COMPLETED
ZDM_PRECHECKS_TGT ............... COMPLETED
ZDM_SETUP_SRC ................... COMPLETED
ZDM_SETUP_TGT ................... COMPLETED
ZDM_PREUSERACTIONS .............. COMPLETED
ZDM_PREUSERACTIONS_TGT .......... COMPLETED
ZDM_VALIDATE_SRC ................ COMPLETED
ZDM_VALIDATE_TGT ................ COMPLETED
ZDM_DISCOVER_SRC ................ COMPLETED
ZDM_COPYFILES ................... COMPLETED
ZDM_PREPARE_TGT ................. COMPLETED
ZDM_SETUP_TDE_TGT ............... COMPLETED
ZDM_RESTORE_TGT ................. COMPLETED
ZDM_RECOVER_TGT ................. COMPLETED
ZDM_FINALIZE_TGT ................ COMPLETED
ZDM_CONFIGURE_DG_SRC ............ COMPLETED
ZDM_SWITCHOVER_SRC .............. PENDING
ZDM_SWITCHOVER_TGT .............. PENDING
ZDM_POST_DATABASE_OPEN_TGT ...... PENDING
ZDM_NONCDBTOPDB_PRECHECK ........ PENDING
ZDM_NONCDBTOPDB_CONVERSION ...... PENDING
ZDM_POST_MIGRATE_TGT ............ PENDING
TIMEZONE_UPGRADE_PREPARE_TGT .... PENDING
TIMEZONE_UPGRADE_TGT ............ PENDING
ZDM_POSTUSERACTIONS ............. PENDING
ZDM_POSTUSERACTIONS_TGT ......... PENDING
ZDM_CLEANUP_SRC ................. PENDING
ZDM_CLEANUP_TGT ................. PENDING

Pause After Phase: "ZDM_CONFIGURE_DG_SRC"
We can check and confirm that the standby (ExaCC) is configured with the primary (on-premises) with no gap.
oracle@vmonpr:/home/oracle/ [ONPR] dgmgrl
DGMGRL for Linux: Release 19.0.0.0.0 - Production on Fri Mar 22 16:40:23 2024
Version 19.22.0.0.0

Copyright (c) 1982, 2019, Oracle and/or its affiliates.  All rights reserved.

Welcome to DGMGRL, type "help" for information.

DGMGRL> connect /
Connected to "ONPR"
Connected as SYSDG.

DGMGRL> show configuration lag

Configuration - ZDM_onpr

  Protection Mode: MaxPerformance
  Members:
  onpr           - Primary database
    onprz_app_001t - Physical standby database
                     Transport Lag:      0 seconds (computed 1 second ago)
                     Apply Lag:          0 seconds (computed 1 second ago)

Fast-Start Failover:  Disabled

Configuration Status:
SUCCESS   (status updated 22 seconds ago)
Run the migration and pause after ZDM_SWITCHOVER_TGT phase (switchover)
We now need the maintenance windows. We will now have ZDM run a switchover. For this, we just need to resume the job and pause it after ZDM_SWITCHOVER_TGT phase.
[zdmuser@zdmhost migration]$ /u01/app/oracle/product/zdm/bin/zdmcli resume job -jobid 75 -pauseafter ZDM_SWITCHOVER_TGT
zdmhost.domain.com: Audit ID: 1165
If we check the job status, we can see that the job is failing on the ZDM_SWITCHOVER_SRC phase.
[zdmuser@zdmhost migration]$ /u01/app/oracle/product/zdm/bin/zdmcli query job -jobid 75
zdmhost.domain.com: Audit ID: 1166
Job ID: 75
User: zdmuser
Client: zdmhost
Job Type: "MIGRATE"
Scheduled job command: "zdmcli migrate database -sourcesid ONPR -rsp /home/zdmuser/migration/zdm_ONPR_physical_online.rsp -sourcenode vmonpr -srcauth zdmauth -srcarg1 user:oracle -srcarg2 identity_file:/home/zdmuser/.ssh/id_rsa -srcarg3 sudo_location:/usr/bin/sudo -targetnode ExaCC-cl01n1 -tgtauth zdmauth -tgtarg1 user:opc -tgtarg2 identity_file:/home/zdmuser/.ssh/id_rsa -tgtarg3 sudo_location:/usr/bin/sudo -tdekeystorepasswd -tgttdekeystorepasswd -pauseafter ZDM_CONFIGURE_DG_SRC"
Scheduled job execution start time: 2024-03-22T15:29:56+01. Equivalent local time: 2024-03-22 15:29:56
Current status: FAILED
Result file path: "/u01/app/oracle/chkbase/scheduled/job-75-2024-03-22-15:30:13.log"
Metrics file path: "/u01/app/oracle/chkbase/scheduled/job-75-2024-03-22-15:30:13.json"
Job execution start time: 2024-03-22 15:30:13
Job execution end time: 2024-03-22 16:43:34
Job execution elapsed time: 22 minutes 4 seconds
ZDM_GET_SRC_INFO ................ COMPLETED
ZDM_GET_TGT_INFO ................ COMPLETED
ZDM_PRECHECKS_SRC ............... COMPLETED
ZDM_PRECHECKS_TGT ............... COMPLETED
ZDM_SETUP_SRC ................... COMPLETED
ZDM_SETUP_TGT ................... COMPLETED
ZDM_PREUSERACTIONS .............. COMPLETED
ZDM_PREUSERACTIONS_TGT .......... COMPLETED
ZDM_VALIDATE_SRC ................ COMPLETED
ZDM_VALIDATE_TGT ................ COMPLETED
ZDM_DISCOVER_SRC ................ COMPLETED
ZDM_COPYFILES ................... COMPLETED
ZDM_PREPARE_TGT ................. COMPLETED
ZDM_SETUP_TDE_TGT ............... COMPLETED
ZDM_RESTORE_TGT ................. COMPLETED
ZDM_RECOVER_TGT ................. COMPLETED
ZDM_FINALIZE_TGT ................ COMPLETED
ZDM_CONFIGURE_DG_SRC ............ COMPLETED
ZDM_SWITCHOVER_SRC .............. FAILED
ZDM_SWITCHOVER_TGT .............. PENDING
ZDM_POST_DATABASE_OPEN_TGT ...... PENDING
ZDM_NONCDBTOPDB_PRECHECK ........ PENDING
ZDM_NONCDBTOPDB_CONVERSION ...... PENDING
ZDM_POST_MIGRATE_TGT ............ PENDING
TIMEZONE_UPGRADE_PREPARE_TGT .... PENDING
TIMEZONE_UPGRADE_TGT ............ PENDING
ZDM_POSTUSERACTIONS ............. PENDING
ZDM_POSTUSERACTIONS_TGT ......... PENDING
ZDM_CLEANUP_SRC ................. PENDING
ZDM_CLEANUP_TGT ................. PENDING

Pause After Phase: "ZDM_SWITCHOVER_TGT"
This is another ZDM bug if configured to use the broker. See my blog here for explanation: https://www.dbi-services.com/blog/zdm-physical-online-migration-failing-during-zdm_switchover_src-phase/
ZDM log is showing:
PRGZ-3605 : Oracle Data Guard Broker switchover to database "ONPRZ_APP_001T" on database "ONPR" failed.
ONPRZ_APP_001T
DGMGRL for Linux: Release 19.0.0.0.0 - Production on Fri Mar 22 15:43:19 2024
Version 19.22.0.0.0

Copyright (c) 1982, 2019, Oracle and/or its affiliates.  All rights reserved.

Welcome to DGMGRL, type "help" for information.
Connected to "ONPR"
Connected as SYSDG.
DGMGRL> Performing switchover NOW, please wait...
Operation requires a connection to database "onprz_app_001t"
Connecting ...
Connected to "ONPRZ_APP_001T"
Connected as SYSDBA.
New primary database "onprz_app_001t" is opening...
Operation requires start up of instance "ONPR" on database "onpr"
Starting instance "ONPR"...
ORA-01017: invalid username/password; logon denied


Please complete the following steps to finish switchover:
        start up and mount instance "ONPR" of database "onpr"
The temporary database on the ExaCC is having PRIMARY role and is opened READ/WRITE.
oracle@ExaCC-cl01n1:/u02/app/oracle/zdm/zdm_ONPR_RZ2_75/zdm/log/ [ONPR1 (CDB$ROOT)] ps -ef | grep [p]mon | grep -i sand
oracle    51392      1  0 14:23 ?        00:00:00 ora_pmon_ONPRZ_APP_001T1

oracle@ExaCC-cl01n1:/u02/app/oracle/zdm/zdm_ONPR_RZ2_75/zdm/log/ [ONPR1 (CDB$ROOT)] export ORACLE_SID=ONPRZ_APP_001T1

oracle@ExaCC-cl01n1:/u02/app/oracle/zdm/zdm_ONPR_RZ2_75/zdm/log/ [ONPRZ_APP_001T1 (CDB$ROOT)] sqh

SQL*Plus: Release 19.0.0.0.0 - Production on Fri Mar 22 16:45:32 2024
Version 19.22.0.0.0

Copyright (c) 1982, 2023, Oracle.  All rights reserved.


Connected to:
Oracle Database 19c EE Extreme Perf Release 19.0.0.0.0 - Production
Version 19.22.0.0.0

SQL> select open_mode, database_role from v$database;

OPEN_MODE            DATABASE_ROLE
-------------------- ----------------
READ WRITE           PRIMARY
The on-premises database is stopped. Let’s start it in MOUNT status.
oracle@vmonpr:/u00/app/oracle/zdm/zdm_ONPR_75/zdm/log/ [ONPR] ONPR
********* dbi services Ltd. *********
STATUS          : STOPPED
*************************************

oracle@vmonpr:/u00/app/oracle/zdm/zdm_ONPR_75/zdm/log/ [ONPR] sqh

SQL*Plus: Release 19.0.0.0.0 - Production on Fri Mar 22 16:45:51 2024
Version 19.22.0.0.0

Copyright (c) 1982, 2023, Oracle.  All rights reserved.

Connected to an idle instance.

SQL> startup mount
ORACLE instance started.

Total System Global Area 2147479664 bytes
Fixed Size                  8941680 bytes
Variable Size            1224736768 bytes
Database Buffers          905969664 bytes
Redo Buffers                7831552 bytes
Database mounted.
And check Data Guard configuration is in sync with no gap.
oracle@vmonpr:/u00/app/oracle/zdm/zdm_ONPR_75/zdm/log/ [ONPR] dgmgrl
DGMGRL for Linux: Release 19.0.0.0.0 - Production on Fri Mar 22 16:47:29 2024
Version 19.22.0.0.0

Copyright (c) 1982, 2019, Oracle and/or its affiliates.  All rights reserved.

Welcome to DGMGRL, type "help" for information.
DGMGRL> connect /
Connected to "ONPR"
Connected as SYSDG.

DGMGRL> show configuration lag

Configuration - ZDM_onpr

  Protection Mode: MaxPerformance
  Members:
  onprz_app_001t - Primary database
    onpr           - Physical standby database
                     Transport Lag:      0 seconds (computed 1 second ago)
                     Apply Lag:          0 seconds (computed 1 second ago)

Fast-Start Failover:  Disabled

Configuration Status:
SUCCESS   (status updated 16 seconds ago)
As we completed the whole ZDM_SWITCHOVER_SRC ZDM phase manually, we need to update ZDM metadata to change the phase to SUCCESS.
[zdmuser@zdmhost vmonpr+ONPR+ExaCC-cl01n1]$ pwd
/u01/app/oracle/chkbase/GHcheckpoints/vmonpr+ONPR+ExaCC-cl01n1

[zdmuser@zdmhost vmonpr+ONPR+ExaCC-cl01n1]$ cp -p vmonpr+ONPR+ExaCC-cl01n1.xml vmonpr+ONPR+ExaCC-cl01n1.xml.20240322_prob_broker

[zdmuser@zdmhost vmonpr+ONPR+ExaCC-cl01n1]$ vi vmonpr+ONPR+ExaCC-cl01n1.xml

[zdmuser@zdmhost vmonpr+ONPR+ExaCC-cl01n1]$ diff vmonpr+ONPR+ExaCC-cl01n1.xml vmonpr+ONPR+ExaCC-cl01n1.xml.20240322_prob_broker
106c106
<    <CHECKPOINT LEVEL="MAJOR" NAME="ZDM_SWITCHOVER_SRC" DESC="ZDM_SWITCHOVER_SRC" STATE="SUCCESS"/>
---
>    <CHECKPOINT LEVEL="MAJOR" NAME="ZDM_SWITCHOVER_SRC" DESC="ZDM_SWITCHOVER_SRC" STATE="START"/>
We can resume the ZDM job again.
[zdmuser@zdmhost vmonpr+ONPR+ExaCC-cl01n1]$ /u01/app/oracle/product/zdm/bin/zdmcli resume job -jobid 75 -pauseafter ZDM_SWITCHOVER_TGT
zdmhost.domain.com: Audit ID: 1167
And see that all phases including the switchover are now completed successfully.
[zdmuser@zdmhost vmonpr+ONPR+ExaCC-cl01n1]$ /u01/app/oracle/product/zdm/bin/zdmcli query job -jobid 75
zdmhost.domain.com: Audit ID: 1168
Job ID: 75
User: zdmuser
Client: zdmhost
Job Type: "MIGRATE"
Scheduled job command: "zdmcli migrate database -sourcesid ONPR -rsp /home/zdmuser/migration/zdm_ONPR_physical_online.rsp -sourcenode vmonpr -srcauth zdmauth -srcarg1 user:oracle -srcarg2 identity_file:/home/zdmuser/.ssh/id_rsa -srcarg3 sudo_location:/usr/bin/sudo -targetnode ExaCC-cl01n1 -tgtauth zdmauth -tgtarg1 user:opc -tgtarg2 identity_file:/home/zdmuser/.ssh/id_rsa -tgtarg3 sudo_location:/usr/bin/sudo -tdekeystorepasswd -tgttdekeystorepasswd -pauseafter ZDM_CONFIGURE_DG_SRC"
Scheduled job execution start time: 2024-03-22T15:29:56+01. Equivalent local time: 2024-03-22 15:29:56
Current status: PAUSED
Current Phase: "ZDM_SWITCHOVER_TGT"
Result file path: "/u01/app/oracle/chkbase/scheduled/job-75-2024-03-22-15:30:13.log"
Metrics file path: "/u01/app/oracle/chkbase/scheduled/job-75-2024-03-22-15:30:13.json"
Job execution start time: 2024-03-22 15:30:13
Job execution end time: 2024-03-22 16:53:21
Job execution elapsed time: 24 minutes 42 seconds
ZDM_GET_SRC_INFO ................ COMPLETED
ZDM_GET_TGT_INFO ................ COMPLETED
ZDM_PRECHECKS_SRC ............... COMPLETED
ZDM_PRECHECKS_TGT ............... COMPLETED
ZDM_SETUP_SRC ................... COMPLETED
ZDM_SETUP_TGT ................... COMPLETED
ZDM_PREUSERACTIONS .............. COMPLETED
ZDM_PREUSERACTIONS_TGT .......... COMPLETED
ZDM_VALIDATE_SRC ................ COMPLETED
ZDM_VALIDATE_TGT ................ COMPLETED
ZDM_DISCOVER_SRC ................ COMPLETED
ZDM_COPYFILES ................... COMPLETED
ZDM_PREPARE_TGT ................. COMPLETED
ZDM_SETUP_TDE_TGT ............... COMPLETED
ZDM_RESTORE_TGT ................. COMPLETED
ZDM_RECOVER_TGT ................. COMPLETED
ZDM_FINALIZE_TGT ................ COMPLETED
ZDM_CONFIGURE_DG_SRC ............ COMPLETED
ZDM_SWITCHOVER_SRC .............. COMPLETED
ZDM_SWITCHOVER_TGT .............. COMPLETED
ZDM_POST_DATABASE_OPEN_TGT ...... PENDING
ZDM_NONCDBTOPDB_PRECHECK ........ PENDING
ZDM_NONCDBTOPDB_CONVERSION ...... PENDING
ZDM_POST_MIGRATE_TGT ............ PENDING
TIMEZONE_UPGRADE_PREPARE_TGT .... PENDING
TIMEZONE_UPGRADE_TGT ............ PENDING
ZDM_POSTUSERACTIONS ............. PENDING
ZDM_POSTUSERACTIONS_TGT ......... PENDING
ZDM_CLEANUP_SRC ................. PENDING
ZDM_CLEANUP_TGT ................. PENDING

Pause After Phase: "ZDM_SWITCHOVER_TGT"
ZDM log is showing some warnings.
zdmhost: 2024-03-22T15:52:03.091Z : Skipping phase ZDM_SWITCHOVER_SRC on resume
zdmhost: 2024-03-22T15:52:03.117Z : Executing phase ZDM_SWITCHOVER_TGT
zdmhost: 2024-03-22T15:52:03.117Z : Switching database ONPR_RZ2 on the target node ExaCC-cl01n1 to primary role ...
ExaCC-cl01n1: 2024-03-22T15:53:21.918Z : WARNING: Post migration, on-premise database will not be in sync with new primary of the database.
ExaCC-cl01n1: 2024-03-22T15:53:21.919Z : Switchover actions in the target environment executed successfully
zdmhost: 2024-03-22T15:53:21.923Z : Execution of phase ZDM_SWITCHOVER_TGT completed
####################################################################
zdmhost: 2024-03-22T15:53:21.936Z : Job execution paused after phase "ZDM_SWITCHOVER_TGT".
We can ignored this warning. Data Guard configuration is in sync and in any case we are not going to use any fallback.
Convert ExaCC target database back to RACWe will now convert the ExaCC target database that will host the future PDB that ZDM will create to RAC. If we do not do so, the PDB will only have one UNDO tablespace and we will have some problem to relocate it then to the final CDB, which will be RAC anyhow.
oracle@ExaCC-cl01n1:~/ [ONPRZ_APP_001T1 (CDB$ROOT)] ONPR1

 **********************************
 INSTANCE_NAME   : ONPR1
 DB_NAME         : ONPR
 DB_UNIQUE_NAME  : ONPR_RZ2
 STATUS          : OPEN READ WRITE
 LOG_MODE        : ARCHIVELOG
 USERS/SESSIONS  : 2/7
 DATABASE_ROLE   : PRIMARY
 FLASHBACK_ON    : YES
 FORCE_LOGGING   : YES
 VERSION         : 19.22.0.0.0
 CDB_ENABLED     : YES
 PDBs            : PDB$SEED
 **********************************

 PDB color: pdbname=mount, pdbname=open read-write, pdbname=open read-only
 Statustime: 2024-03-21 09:30:32

oracle@ExaCC-cl01n1:~/ [ONPR1 (CDB$ROOT)] sqh

SQL*Plus: Release 19.0.0.0.0 - Production on Fri Mar 22 16:56:19 2024
Version 19.22.0.0.0

Copyright (c) 1982, 2023, Oracle.  All rights reserved.


Connected to:
Oracle Database 19c EE Extreme Perf Release 19.0.0.0.0 - Production
Version 19.22.0.0.0

SQL> select inst_id, name, value from gv$parameter where lower(name)='cluster_database';

   INST_ID NAME                 VALUE
---------- -------------------- --------------------
         1 cluster_database     FALSE

SQL> alter system set cluster_database=TRUE scope=spfile sid='*';

System altered.

oracle@ExaCC-cl01n1:~/ [ONPR1 (CDB$ROOT)] srvctl status database -d ONPR_RZ2
Instance ONPR1 is running on node ExaCC-cl01n1

oracle@ExaCC-cl01n1:~/ [ONPR1 (CDB$ROOT)] srvctl stop database -d ONPR_RZ2

oracle@ExaCC-cl01n1:~/ [ONPR1 (CDB$ROOT)] srvctl status database -d ONPR_RZ2
Instance ONPR1 is not running on node ExaCC-cl01n1

oracle@ExaCC-cl01n1:~/ [ONPR1 (CDB$ROOT)] srvctl add instance -d ONPR_RZ2 -i ONPR2 -node ExaCC-cl01n2

oracle@ExaCC-cl01n1:~/ [ONPR1 (CDB$ROOT)] srvctl start database -d ONPR_RZ2

oracle@ExaCC-cl01n1:~/ [ONPR1 (CDB$ROOT)] srvctl status database -d ONPR_RZ2
Instance ONPR1 is running on node ExaCC-cl01n1
Instance ONPR2 is running on node ExaCC-cl01n2

oracle@ExaCC-cl01n1:~/ [ONPR1 (CDB$ROOT)] sqh

SQL*Plus: Release 19.0.0.0.0 - Production on Fri Mar 22 16:58:36 2024
Version 19.22.0.0.0

Copyright (c) 1982, 2023, Oracle.  All rights reserved.


Connected to:
Oracle Database 19c EE Extreme Perf Release 19.0.0.0.0 - Production
Version 19.22.0.0.0

SQL> select inst_id, name, value from gv$parameter where lower(name)='cluster_database';

   INST_ID NAME                 VALUE
---------- -------------------- --------------------
         2 cluster_database     TRUE
         1 cluster_database     TRUE
Compatible parameter
Compatible parameter for a 19c database should, in main situation, be configured at 19.0.0. There is no real reason to change it to another more specific one. If it is the case, we need to change the target database compatible parameter, to have the source and target matching. This will also have to be taken in account for PDB relocation.
Run the migrationWe can now run the ZDM job with no pause, so have it run until the end. This will include the non-cdb to cdb conversion and database timezone update.
[zdmuser@zdmhost vmonpr+ONPR+ExaCC-cl01n1]$ /u01/app/oracle/product/zdm/bin/zdmcli resume job -jobid 75
zdmhost.domain.com: Audit ID: 1169
The job has been completed successfully.
[zdmuser@zdmhost vmonpr+ONPR+ExaCC-cl01n1]$ /u01/app/oracle/product/zdm/bin/zdmcli query job -jobid 75
zdmhost.domain.com: Audit ID: 1172
Job ID: 75
User: zdmuser
Client: zdmhost
Job Type: "MIGRATE"
Scheduled job command: "zdmcli migrate database -sourcesid ONPR -rsp /home/zdmuser/migration/zdm_ONPR_physical_online.rsp -sourcenode vmonpr -srcauth zdmauth -srcarg1 user:oracle -srcarg2 identity_file:/home/zdmuser/.ssh/id_rsa -srcarg3 sudo_location:/usr/bin/sudo -targetnode ExaCC-cl01n1 -tgtauth zdmauth -tgtarg1 user:opc -tgtarg2 identity_file:/home/zdmuser/.ssh/id_rsa -tgtarg3 sudo_location:/usr/bin/sudo -tdekeystorepasswd -tgttdekeystorepasswd -pauseafter ZDM_CONFIGURE_DG_SRC"
Scheduled job execution start time: 2024-03-22T15:29:56+01. Equivalent local time: 2024-03-22 15:29:56
Current status: SUCCEEDED
Result file path: "/u01/app/oracle/chkbase/scheduled/job-75-2024-03-22-15:30:13.log"
Metrics file path: "/u01/app/oracle/chkbase/scheduled/job-75-2024-03-22-15:30:13.json"
Job execution start time: 2024-03-22 15:30:13
Job execution end time: 2024-03-22 17:08:49
Job execution elapsed time: 33 minutes 18 seconds
ZDM_GET_SRC_INFO ................ COMPLETED
ZDM_GET_TGT_INFO ................ COMPLETED
ZDM_PRECHECKS_SRC ............... COMPLETED
ZDM_PRECHECKS_TGT ............... COMPLETED
ZDM_SETUP_SRC ................... COMPLETED
ZDM_SETUP_TGT ................... COMPLETED
ZDM_PREUSERACTIONS .............. COMPLETED
ZDM_PREUSERACTIONS_TGT .......... COMPLETED
ZDM_VALIDATE_SRC ................ COMPLETED
ZDM_VALIDATE_TGT ................ COMPLETED
ZDM_DISCOVER_SRC ................ COMPLETED
ZDM_COPYFILES ................... COMPLETED
ZDM_PREPARE_TGT ................. COMPLETED
ZDM_SETUP_TDE_TGT ............... COMPLETED
ZDM_RESTORE_TGT ................. COMPLETED
ZDM_RECOVER_TGT ................. COMPLETED
ZDM_FINALIZE_TGT ................ COMPLETED
ZDM_CONFIGURE_DG_SRC ............ COMPLETED
ZDM_SWITCHOVER_SRC .............. COMPLETED
ZDM_SWITCHOVER_TGT .............. COMPLETED
ZDM_POST_DATABASE_OPEN_TGT ...... COMPLETED
ZDM_NONCDBTOPDB_PRECHECK ........ COMPLETED
ZDM_NONCDBTOPDB_CONVERSION ...... COMPLETED
ZDM_POST_MIGRATE_TGT ............ COMPLETED
TIMEZONE_UPGRADE_PREPARE_TGT .... COMPLETED
TIMEZONE_UPGRADE_TGT ............ COMPLETED
ZDM_POSTUSERACTIONS ............. COMPLETED
ZDM_POSTUSERACTIONS_TGT ......... COMPLETED
ZDM_CLEANUP_SRC ................. COMPLETED
ZDM_CLEANUP_TGT ................. COMPLETED
Checks
If we check the new PDB, we can see that the new PDB is opened READ/WRITE with no restriction.
oracle@ExaCC-cl01n1:/u02/app/oracle/zdm/zdm_ONPR_RZ2_75/zdm/log/ [ONPR1 (CDB$ROOT)] sqh

SQL*Plus: Release 19.0.0.0.0 - Production on Fri Mar 22 17:11:34 2024
Version 19.22.0.0.0

Copyright (c) 1982, 2023, Oracle.  All rights reserved.


Connected to:
Oracle Database 19c EE Extreme Perf Release 19.0.0.0.0 - Production
Version 19.22.0.0.0

SQL> show pdbs

    CON_ID CON_NAME                       OPEN MODE  RESTRICTED
---------- ------------------------------ ---------- ----------
         2 PDB$SEED                       READ ONLY  NO
         3 ONPRZ_APP_001T                 READ WRITE NO
The application tablespaces are all encrypted. The SYSTEM, SYSAUX, UNDO and TEMP tablespace are not encrypted. This is expected. We will encrypt them manually.
We can check the pdb violations.
SQL> alter session set container=ONPRZ_APP_001T;

Session altered.

SQL> select status, message from pdb_plug_in_violations;

STATUS    MESSAGE
--------- ------------------------------------------------------------------------------------------------------------------------
RESOLVED  PDB needs to import keys from source.
RESOLVED  Database option RAC mismatch: PDB installed version NULL. CDB installed version 19.0.0.0.0.
RESOLVED  PDB plugged in is a non-CDB, requires noncdb_to_pdb.sql be run.
PENDING   Database option APS mismatch: PDB installed version NULL. CDB installed version 19.0.0.0.0.
PENDING   Database option CATJAVA mismatch: PDB installed version NULL. CDB installed version 19.0.0.0.0.
PENDING   Database option CONTEXT mismatch: PDB installed version NULL. CDB installed version 19.0.0.0.0.
PENDING   Database option DV mismatch: PDB installed version NULL. CDB installed version 19.0.0.0.0.
PENDING   Database option JAVAVM mismatch: PDB installed version NULL. CDB installed version 19.0.0.0.0.
PENDING   Database option OLS mismatch: PDB installed version NULL. CDB installed version 19.0.0.0.0.
PENDING   Database option ORDIM mismatch: PDB installed version NULL. CDB installed version 19.0.0.0.0.
PENDING   Database option SDO mismatch: PDB installed version NULL. CDB installed version 19.0.0.0.0.
PENDING   Database option XML mismatch: PDB installed version NULL. CDB installed version 19.0.0.0.0.
PENDING   Database option XOQ mismatch: PDB installed version NULL. CDB installed version 19.0.0.0.0.
PENDING   Tablespace SYSTEM is not encrypted. Oracle Cloud mandates all tablespaces should be encrypted.
PENDING   Tablespace SYSAUX is not encrypted. Oracle Cloud mandates all tablespaces should be encrypted.

15 rows selected.
The database option can be ignored. See “OPTION WARNING Database option mismatch: PDB installed version NULL” in PDB_PLUG_IN_VIOLATIONS (Doc ID 2020172.1). The encryption one will be resolved once the tablespace will be encrypted manually. There is various method to do this and will not be described here in details.
To check tablespace encryption:
SQL> select a.con_id, a.tablespace_name, nvl(b.ENCRYPTIONALG,'NOT ENCRYPTED') from  cdb_tablespaces a, (select x.con_id, y.ENCRYPTIONALG, x.name from V$TABLESPACE x,  V$ENCRYPTED_TABLESPACES y
  where x.ts#=y.ts# and x.con_id=y.con_id) b where a.con_id=b.con_id(+) and a.tablespace_name=b.name(+) order by 1,2;
To encrypt the tablespace, we used following query, ran after having closed all PDB instances:
set serveroutput on;

DECLARE
  CURSOR c_cur IS
    SELECT name FROM V$TABLESPACE;
  e_already_encrypted EXCEPTION;
  pragma exception_init( e_already_encrypted, -28431);
  e_tmp_cant_be_encrypted EXCEPTION;
  pragma exception_init( e_tmp_cant_be_encrypted, -28370);
  l_cmd VARCHAR2(200);
BEGIN
  FOR r_rec IN c_cur LOOP
    l_cmd := 'ALTER TABLESPACE '|| r_rec.name || ' ENCRYPTION OFFLINE ENCRYPT';
    dbms_output.put_line('Command: '|| l_cmd );
    BEGIN
      EXECUTE IMMEDIATE l_cmd;
    EXCEPTION
      WHEN e_already_encrypted THEN NULL;
      -- ORA-28431: cannot encrypt an already encrypted data file UNDOTBS1
      WHEN e_tmp_cant_be_encrypted THEN
        dbms_output.put_line('CAUTION ! needs further actions for '|| r_rec.name ||' as of ORA-28370: ENCRYPT, DECRYPT or REKEY option not allowed');
        NULL;
      -- ORA-28370: ENCRYPT, DECRYPT or REKEY option not allowed
    END;
  END LOOP;
END;
/
TEMP tablespace will have to be recreated. This is a normal DBA tasks. Once created again, TEMP tablespace will be also encrypted.
Relocate PDBWe can now relocate the migrated PDB to one of the CDB on the ExaCC side.
To do this, we first have to create a new master key for the PDB.
oracle@ExaCC-cl01n1:/u02/app/oracle/zdm/zdm_ONPR_RZ2_75/zdm/log/ [ONPR1 (CDB$ROOT)] sqh

SQL*Plus: Release 19.0.0.0.0 - Production on Fri Mar 22 17:11:34 2024
Version 19.22.0.0.0

Copyright (c) 1982, 2023, Oracle.  All rights reserved.


Connected to:
Oracle Database 19c EE Extreme Perf Release 19.0.0.0.0 - Production
Version 19.22.0.0.0

SQL> show pdbs

    CON_ID CON_NAME                       OPEN MODE  RESTRICTED
---------- ------------------------------ ---------- ----------
         2 PDB$SEED                       READ ONLY  NO
         3 ONPRZ_APP_001T                 READ WRITE NO

SQL> alter session set container=ONPRZ_APP_001T;

Session altered.

SQL> ADMINISTER KEY MANAGEMENT SET KEY FORCE KEYSTORE IDENTIFIED BY "*****************" WITH BACKUP USING 'pre-relocate-ONPRZ_APP_001T';

keystore altered.
And we can relocate the database using dbaascli command.
oracle@ExaCC-cl01n1:~/ [ONPR1 (CDB$ROOT)] dbaascli pdb relocate --sourceDBConnectionString ExaCC-cl01-scan:1521/ONPR_RZ2.domain.com --pdbName ONPRZ_APP_001T --dbName XXXXX100T
with:
–sourceDBConnectionString = Easyconnect to current target database used for the migration and containing the PDB
–pdbName = the name of the PDB to relocate
–dbName = the final CDB DB_NAME
If we check the PBD violations, we can see that everything is now ok.
SQL> select status, message from pdb_plug_in_violations;

STATUS     MESSAGE
---------- ----------------------------------------------------------------------------------------------------
PENDING    Database option APS mismatch: PDB installed version NULL. CDB installed version 19.0.0.0.0.
PENDING    Database option CATJAVA mismatch: PDB installed version NULL. CDB installed version 19.0.0.0.0.
PENDING    Database option CONTEXT mismatch: PDB installed version NULL. CDB installed version 19.0.0.0.0.
PENDING    Database option DV mismatch: PDB installed version NULL. CDB installed version 19.0.0.0.0.
PENDING    Database option JAVAVM mismatch: PDB installed version NULL. CDB installed version 19.0.0.0.0.
PENDING    Database option OLS mismatch: PDB installed version NULL. CDB installed version 19.0.0.0.0.
PENDING    Database option ORDIM mismatch: PDB installed version NULL. CDB installed version 19.0.0.0.0.
PENDING    Database option SDO mismatch: PDB installed version NULL. CDB installed version 19.0.0.0.0.
PENDING    Database option XML mismatch: PDB installed version NULL. CDB installed version 19.0.0.0.0.
PENDING    Database option XOQ mismatch: PDB installed version NULL. CDB installed version 19.0.0.0.0.

10 rows selected.
The database option violations can be ignored. See “OPTION WARNING Database option mismatch: PDB installed version NULL” in PDB_PLUG_IN_VIOLATIONS (Doc ID 2020172.1)
FallbackIn case the test before putting the PDB in production is not satisfying a GO-LIVE, we can revert on-premises database to PRIMARY ROLE.
oracle@vmonpr:~/ [ONPR] sqh

SQL> recover managed standby database cancel;
ORA-16136: Managed Standby Recovery not active

SQL> alter database recover managed standby database finish;

Database altered.

SQL> select name,open_mode,database_role from v$database;

NAME      OPEN_MODE            DATABASE_ROLE
--------- -------------------- ----------------
ONPR      MOUNTED              PHYSICAL STANDBY

SQL> shutdown immediate;
ORA-01109: database not open

Database dismounted.
ORACLE instance shut down.

SQL> startup
ORACLE instance started.

Total System Global Area 2147479664 bytes
Fixed Size                  8941680 bytes
Variable Size            1224736768 bytes
Database Buffers          905969664 bytes
Redo Buffers                7831552 bytes
Database mounted.
Database opened.

SQL> select name,open_mode,database_role from v$database;

NAME      OPEN_MODE            DATABASE_ROLE
--------- -------------------- ----------------
ONPR      READ ONLY            PHYSICAL STANDBY

SQL> shutdown immediate
Database closed.
Database dismounted.
ORACLE instance shut down.

SQL> startup mount
ORACLE instance started.

Total System Global Area 2147479664 bytes
Fixed Size                  8941680 bytes
Variable Size            1224736768 bytes
Database Buffers          905969664 bytes
Redo Buffers                7831552 bytes
Database mounted.

SQL> select name,open_mode,database_role from v$database;

NAME      OPEN_MODE            DATABASE_ROLE
--------- -------------------- ----------------
ONPR      MOUNTED              PHYSICAL STANDBY

SQL> alter database activate standby database;

Database altered.

SQL> alter database open;

Database altered.

SQL> select name,open_mode,database_role from v$database;

NAME      OPEN_MODE            DATABASE_ROLE
--------- -------------------- ----------------
ONPR      READ WRITE           PRIMARY
To wrap up
This is a real success story. We have been able to successfully migrate, using ZDM Physical Online, an on-premises database to the new ExaCC. I would like to thank the ZDM product management and development team for their availability and great help to quickly solve ORA-28374 error which was blocking the migration.
L’article ZDM Physical Online Migration – A success story est apparu en premier sur dbi Blog.
ZDM Physical Online Migration failing during ZDM_SWITCHOVER_SRC phase
When using ZDM for a Physical Online Migration, even in the last current version, 21.4.5.0.0, switchover is failing. In this blog, I will share the reason and the solution to solve the problem before moving forward with the migration.
Problem descriptionWe are using last version of ZDM :
[zdmuser@zdmhost migration]$ /u01/app/oracle/product/zdm/bin/zdmcli -build
version: 21.0.0.0.0
full version: 21.4.0.0.0
patch version: 21.4.5.0.0
label date: 221207.30
ZDM kit build date: Mar 21 2024 22:07:12 UTC
CPAT build version: 23.12.0
ZDM Response file parameter has been setup to use broker during migration: ZDM_USE_DG_BROKER=TRUE
This problem might not happened if not using the broker to run the switchover operation. We have decided to use the broker to be able to easily check and monitor the synchronisation between our on-premise database and the ExaCC one.
The on-premise database is here called ONPR, and the final PDB, ZDM needs to create and migrate to, will be ONPRZ_APP_001T. We configured ZDM to include non-cdb to cdb migration.
We have run ZDM Migration and paused it just after Data Guard is configured.
[zdmuser@zdmhost migration]$ /u01/app/oracle/product/zdm/bin/zdmcli query job -jobid 75
zdmhost.balgroupit.com: Audit ID: 1164
Job ID: 75
User: zdmuser
Client: zdmhost
Job Type: "MIGRATE"
Scheduled job command: "zdmcli migrate database -sourcesid ONPR -rsp /home/zdmuser/migration/zdm_ONPR_physical_online.rsp -sourcenode vmonpr -srcauth zdmauth -srcarg1 user:oracle -srcarg2 identity_file:/home/zdmuser/.ssh/id_rsa -srcarg3 sudo_location:/usr/bin/sudo -targetnode ExaCC-cl01n1 -tgtauth zdmauth -tgtarg1 user:opc -tgtarg2 identity_file:/home/zdmuser/.ssh/id_rsa -tgtarg3 sudo_location:/usr/bin/sudo -tdekeystorepasswd -tgttdekeystorepasswd -pauseafter ZDM_CONFIGURE_DG_SRC"
Scheduled job execution start time: 2024-03-22T15:29:56+01. Equivalent local time: 2024-03-22 15:29:56
Current status: PAUSED
Current Phase: "ZDM_CONFIGURE_DG_SRC"
Result file path: "/u01/app/oracle/chkbase/scheduled/job-75-2024-03-22-15:30:13.log"
Metrics file path: "/u01/app/oracle/chkbase/scheduled/job-75-2024-03-22-15:30:13.json"
Job execution start time: 2024-03-22 15:30:13
Job execution end time: 2024-03-22 16:32:20
Job execution elapsed time: 19 minutes 44 seconds
ZDM_GET_SRC_INFO ................ COMPLETED
ZDM_GET_TGT_INFO ................ COMPLETED
ZDM_PRECHECKS_SRC ............... COMPLETED
ZDM_PRECHECKS_TGT ............... COMPLETED
ZDM_SETUP_SRC ................... COMPLETED
ZDM_SETUP_TGT ................... COMPLETED
ZDM_PREUSERACTIONS .............. COMPLETED
ZDM_PREUSERACTIONS_TGT .......... COMPLETED
ZDM_VALIDATE_SRC ................ COMPLETED
ZDM_VALIDATE_TGT ................ COMPLETED
ZDM_DISCOVER_SRC ................ COMPLETED
ZDM_COPYFILES ................... COMPLETED
ZDM_PREPARE_TGT ................. COMPLETED
ZDM_SETUP_TDE_TGT ............... COMPLETED
ZDM_RESTORE_TGT ................. COMPLETED
ZDM_RECOVER_TGT ................. COMPLETED
ZDM_FINALIZE_TGT ................ COMPLETED
ZDM_CONFIGURE_DG_SRC ............ COMPLETED
ZDM_SWITCHOVER_SRC .............. PENDING
ZDM_SWITCHOVER_TGT .............. PENDING
ZDM_POST_DATABASE_OPEN_TGT ...... PENDING
ZDM_NONCDBTOPDB_PRECHECK ........ PENDING
ZDM_NONCDBTOPDB_CONVERSION ...... PENDING
ZDM_POST_MIGRATE_TGT ............ PENDING
TIMEZONE_UPGRADE_PREPARE_TGT .... PENDING
TIMEZONE_UPGRADE_TGT ............ PENDING
ZDM_POSTUSERACTIONS ............. PENDING
ZDM_POSTUSERACTIONS_TGT ......... PENDING
ZDM_CLEANUP_SRC ................. PENDING
ZDM_CLEANUP_TGT ................. PENDING

Pause After Phase: "ZDM_CONFIGURE_DG_SRC"
[zdmuser@zdmhost migration]$
This will give us the opportunity to have done all the preparation without any downtime and we can wait for the migration maintenance window.
The Standby on the ExaCC is synchronised with the primary on-premise database. There is no lag.
oracle@vmonpr:/home/oracle/ [ONPR] dgmgrl
DGMGRL for Linux: Release 19.0.0.0.0 - Production on Fri Mar 22 16:40:23 2024
Version 19.22.0.0.0

Copyright (c) 1982, 2019, Oracle and/or its affiliates.  All rights reserved.

Welcome to DGMGRL, type "help" for information.

DGMGRL> connect /
Connected to "ONPR"
Connected as SYSDG.

DGMGRL> show configuration lag

Configuration - ZDM_onpr

  Protection Mode: MaxPerformance
  Members:
  onpr           - Primary database
    onprz_app_001t - Physical standby database
                     Transport Lag:      0 seconds (computed 1 second ago)
                     Apply Lag:          0 seconds (computed 1 second ago)

Fast-Start Failover:  Disabled

Configuration Status:
SUCCESS   (status updated 22 seconds ago)
We resume ZDM migration job now, adding a pause just after switchover has been completed.
[zdmuser@zdmhost migration]$ /u01/app/oracle/product/zdm/bin/zdmcli resume job -jobid 75 -pauseafter ZDM_SWITCHOVER_TGT
zdmhost.balgroupit.com: Audit ID: 1165
As we can see the job failed during the ZDM_SWITCHOVER_SRC phase.
[zdmuser@zdmhost migration]$ /u01/app/oracle/product/zdm/bin/zdmcli query job -jobid 75
zdmhost.balgroupit.com: Audit ID: 1166
Job ID: 75
User: zdmuser
Client: zdmhost
Job Type: "MIGRATE"
Scheduled job command: "zdmcli migrate database -sourcesid ONPR -rsp /home/zdmuser/migration/zdm_ONPR_physical_online.rsp -sourcenode vmonpr -srcauth zdmauth -srcarg1 user:oracle -srcarg2 identity_file:/home/zdmuser/.ssh/id_rsa -srcarg3 sudo_location:/usr/bin/sudo -targetnode ExaCC-cl01n1 -tgtauth zdmauth -tgtarg1 user:opc -tgtarg2 identity_file:/home/zdmuser/.ssh/id_rsa -tgtarg3 sudo_location:/usr/bin/sudo -tdekeystorepasswd -tgttdekeystorepasswd -pauseafter ZDM_CONFIGURE_DG_SRC"
Scheduled job execution start time: 2024-03-22T15:29:56+01. Equivalent local time: 2024-03-22 15:29:56
Current status: FAILED
Result file path: "/u01/app/oracle/chkbase/scheduled/job-75-2024-03-22-15:30:13.log"
Metrics file path: "/u01/app/oracle/chkbase/scheduled/job-75-2024-03-22-15:30:13.json"
Job execution start time: 2024-03-22 15:30:13
Job execution end time: 2024-03-22 16:43:34
Job execution elapsed time: 22 minutes 4 seconds
ZDM_GET_SRC_INFO ................ COMPLETED
ZDM_GET_TGT_INFO ................ COMPLETED
ZDM_PRECHECKS_SRC ............... COMPLETED
ZDM_PRECHECKS_TGT ............... COMPLETED
ZDM_SETUP_SRC ................... COMPLETED
ZDM_SETUP_TGT ................... COMPLETED
ZDM_PREUSERACTIONS .............. COMPLETED
ZDM_PREUSERACTIONS_TGT .......... COMPLETED
ZDM_VALIDATE_SRC ................ COMPLETED
ZDM_VALIDATE_TGT ................ COMPLETED
ZDM_DISCOVER_SRC ................ COMPLETED
ZDM_COPYFILES ................... COMPLETED
ZDM_PREPARE_TGT ................. COMPLETED
ZDM_SETUP_TDE_TGT ............... COMPLETED
ZDM_RESTORE_TGT ................. COMPLETED
ZDM_RECOVER_TGT ................. COMPLETED
ZDM_FINALIZE_TGT ................ COMPLETED
ZDM_CONFIGURE_DG_SRC ............ COMPLETED
ZDM_SWITCHOVER_SRC .............. FAILED
ZDM_SWITCHOVER_TGT .............. PENDING
ZDM_POST_DATABASE_OPEN_TGT ...... PENDING
ZDM_NONCDBTOPDB_PRECHECK ........ PENDING
ZDM_NONCDBTOPDB_CONVERSION ...... PENDING
ZDM_POST_MIGRATE_TGT ............ PENDING
TIMEZONE_UPGRADE_PREPARE_TGT .... PENDING
TIMEZONE_UPGRADE_TGT ............ PENDING
ZDM_POSTUSERACTIONS ............. PENDING
ZDM_POSTUSERACTIONS_TGT ......... PENDING
ZDM_CLEANUP_SRC ................. PENDING
ZDM_CLEANUP_TGT ................. PENDING

Pause After Phase: "ZDM_SWITCHOVER_TGT"
ZDM log will display following information, showing that the switchover is failing on starting the old primary on-premise database.
####################################################################
PRGZ-3605 : Oracle Data Guard Broker switchover to database "ONPRZ_APP_001T" on database "ONPR" failed.
ONPRZ_APP_001T
DGMGRL for Linux: Release 19.0.0.0.0 - Production on Fri Mar 22 15:43:19 2024
Version 19.22.0.0.0

Copyright (c) 1982, 2019, Oracle and/or its affiliates.  All rights reserved.

Welcome to DGMGRL, type "help" for information.
Connected to "ONPR"
Connected as SYSDG.
DGMGRL> Performing switchover NOW, please wait...
Operation requires a connection to database "onprz_app_001t"
Connecting ...
Connected to "ONPRZ_APP_001T"
Connected as SYSDBA.
New primary database "onprz_app_001t" is opening...
Operation requires start up of instance "ONPR" on database "onpr"
Starting instance "ONPR"...
ORA-01017: invalid username/password; logon denied


Please complete the following steps to finish switchover:
        start up and mount instance "ONPR" of database "onpr"

DGMGRL>We can see that the temporary database, created on the ExaCC by ZDM, has got the primary role and is opened READ WRITE.
oracle@ExaCC-cl01n1:/u02/app/oracle/zdm/zdm_ONPR_RZ2_70/zdm/log/ [ONPR1 (CDB$ROOT)] ps -ef | grep [p]mon | grep -i onprz
oracle    51392      1  0 14:23 ?        00:00:00 ora_pmon_ONPRZ_APP_001T1

oracle@ExaCC-cl01n1:/u02/app/oracle/zdm/zdm_ONPR_RZ2_70/zdm/log/ [ONPR1 (CDB$ROOT)] export ORACLE_SID=ONPRZ_APP_001T1

oracle@ExaCC-cl01n1:/u02/app/oracle/zdm/zdm_ONPR_RZ2_72/zdm/log/ [ONPRZ_APP_001T1 (CDB$ROOT)] sqh

SQL*Plus: Release 19.0.0.0.0 - Production on Fri Mar 22 16:45:32 2024
Version 19.22.0.0.0

Copyright (c) 1982, 2023, Oracle.  All rights reserved.


Connected to:
Oracle Database 19c EE Extreme Perf Release 19.0.0.0.0 - Production
Version 19.22.0.0.0

SQL> select open_mode, database_role from v$database;

OPEN_MODE            DATABASE_ROLE
-------------------- ----------------
READ WRITE           PRIMARY
But the on-premise database is stopped when it should be started in MOUNT status and have standby role.
oracle@vmonpr:/u00/app/oracle/zdm/zdm_ONPR_75/zdm/log/ [ONPR] ONPR
********* dbi services Ltd. *********
STATUS          : STOPPED
*************************************
This is due to the fact that ZDM is incorrectly setting the connection, using a local SYS authentication (dgmgrl /) rather than going through the listener, which is mandatory for a switchover operation. This can be seen in the ZDM logs.
oracle@vmonpr:/u00/app/oracle/zdm/zdm_ONPR_75/zdm/log/ [ONPR] grep dgmgrl zdm_switchover_src_24209.log
[jobid-75][2024-03-22T15:43:19Z][mZDM_Queries.pm:9597]:[DEBUG] Will be running following dgmgrl statements as user: oracle:
                  /u00/app/oracle/product/19.22.0.0.240116.EE/bin/dgmgrl /
[jobid-75][2024-03-22T15:43:19Z][mZDM_Utils.pm:3450]:[DEBUG] run_as_user2InMem: Running /u00/app/oracle/product/19.22.0.0.240116.EE/bin/dgmgrl /
[jobid-75][2024-03-22T15:43:34Z][mZDM_Utils.pm:3473]:[DEBUG] Remove /u00/app/oracle/zdm/zdm_ONPR_75/zdm/log/zdm_dgmgrl_out_c7pQRGXf
[jobid-75][2024-03-22T15:43:34Z][mZDM_Utils.pm:3482]:[DEBUG] /u00/app/oracle/product/19.22.0.0.240116.EE/bin/dgmgrl / successfully executed
[jobid-75][2024-03-22T15:43:34Z][mZDM_Queries.pm:9544]:[DEBUG] Successfully executed dgmgrl script 'switchover to 'onprz_app_001t';'
oracle@vmonpr:/u00/app/oracle/zdm/zdm_ONPR_75/zdm/log/ [ONPR]
Solution
We first start the on-premise database.
oracle@vmonpr:/u00/app/oracle/zdm/zdm_ONPR_75/zdm/log/ [ONPR] sqh

SQL*Plus: Release 19.0.0.0.0 - Production on Fri Mar 22 16:45:51 2024
Version 19.22.0.0.0

Copyright (c) 1982, 2023, Oracle.  All rights reserved.

Connected to an idle instance.

SQL> startup mount
ORACLE instance started.

Total System Global Area 2147479664 bytes
Fixed Size                  8941680 bytes
Variable Size            1224736768 bytes
Database Buffers          905969664 bytes
Redo Buffers                7831552 bytes
Database mounted.
We check Data Guard configuration to ensure the on-premise standby is synchronised with the primary database. We should not have any gap.
oracle@vmonpr:/u00/app/oracle/zdm/zdm_ONPR_75/zdm/log/ [ONPR] dgmgrl
DGMGRL for Linux: Release 19.0.0.0.0 - Production on Fri Mar 22 16:47:29 2024
Version 19.22.0.0.0

Copyright (c) 1982, 2019, Oracle and/or its affiliates.  All rights reserved.

Welcome to DGMGRL, type "help" for information.
DGMGRL> connect /
Connected to "ONPR"
Connected as SYSDG.

DGMGRL> show configuration lag

Configuration - ZDM_onpr

  Protection Mode: MaxPerformance
  Members:
  onprz_app_001t - Primary database
    onpr           - Physical standby database
                     Transport Lag:      0 seconds (computed 1 second ago)
                     Apply Lag:          0 seconds (computed 1 second ago)

Fast-Start Failover:  Disabled

Configuration Status:
SUCCESS   (status updated 16 seconds ago)

DGMGRL>
Now, we can not just resume ZDM job, because it will retry the last failed phase, which is ZDM_SWITCHOVER_SRC, trying to do the switchover again. And it will fail as on-premise database is not primary any more. The role has been already switched.
This is why, we do not have any other choice than updating the ZDM metadata XML file to change the status of this phase to SUCCESS, knowing we have manually resolved and completed it.
The XML metadata file can be found in the directory GHcheckpoints/<SOURCE_HOST>+<ORACLE_SID>+<TARGET_HOST>. The XML file name is <SOURCE_HOST>+<ORACLE_SID>+<TARGET_HOST>.xml.
We need to update the file as following.
[zdmuser@zdmhost vmonpr+ONPR+ExaCC-cl01n1]$ pwd
/u01/app/oracle/chkbase/GHcheckpoints/vmonpr+ONPR+ExaCC-cl01n1

[zdmuser@zdmhost vmonpr+ONPR+ExaCC-cl01n1]$ cp -p vmonpr+ONPR+ExaCC-cl01n1.xml vmonpr+ONPR+ExaCC-cl01n1.xml.20240322_prob_broker

[zdmuser@zdmhost vmonpr+ONPR+ExaCC-cl01n1]$ vi vmonpr+ONPR+ExaCC-cl01n1.xml

[zdmuser@zdmhost vmonpr+ONPR+ExaCC-cl01n1]$ diff vmonpr+ONPR+ExaCC-cl01n1.xml vmonpr+ONPR+ExaCC-cl01n1.xml.20240322_prob_broker
106c106
<    <CHECKPOINT LEVEL="MAJOR" NAME="ZDM_SWITCHOVER_SRC" DESC="ZDM_SWITCHOVER_SRC" STATE="SUCCESS"/>
---
>    <CHECKPOINT LEVEL="MAJOR" NAME="ZDM_SWITCHOVER_SRC" DESC="ZDM_SWITCHOVER_SRC" STATE="START"/>
We can now resume the job as before the problem.
[zdmuser@zdmhost vmonpr+ONPR+ExaCC-cl01n1]$ /u01/app/oracle/product/zdm/bin/zdmcli resume job -jobid 75 -pauseafter ZDM_SWITCHOVER_TGT
zdmhost.balgroupit.com: Audit ID: 1167
And see that it has been completed successfully now, and waiting for the next resume. All new phases have been completed successfully, and the job status is set to PAUSED.
[zdmuser@zdmhost vmonpr+ONPR+ExaCC-cl01n1]$ /u01/app/oracle/product/zdm/bin/zdmcli query job -jobid 75
zdmhost.balgroupit.com: Audit ID: 1168
Job ID: 75
User: zdmuser
Client: zdmhost
Job Type: "MIGRATE"
Scheduled job command: "zdmcli migrate database -sourcesid ONPR -rsp /home/zdmuser/migration/zdm_ONPR_physical_online.rsp -sourcenode vmonpr -srcauth zdmauth -srcarg1 user:oracle -srcarg2 identity_file:/home/zdmuser/.ssh/id_rsa -srcarg3 sudo_location:/usr/bin/sudo -targetnode ExaCC-cl01n1 -tgtauth zdmauth -tgtarg1 user:opc -tgtarg2 identity_file:/home/zdmuser/.ssh/id_rsa -tgtarg3 sudo_location:/usr/bin/sudo -tdekeystorepasswd -tgttdekeystorepasswd -pauseafter ZDM_CONFIGURE_DG_SRC"
Scheduled job execution start time: 2024-03-22T15:29:56+01. Equivalent local time: 2024-03-22 15:29:56
Current status: PAUSED
Current Phase: "ZDM_SWITCHOVER_TGT"
Result file path: "/u01/app/oracle/chkbase/scheduled/job-75-2024-03-22-15:30:13.log"
Metrics file path: "/u01/app/oracle/chkbase/scheduled/job-75-2024-03-22-15:30:13.json"
Job execution start time: 2024-03-22 15:30:13
Job execution end time: 2024-03-22 16:53:21
Job execution elapsed time: 24 minutes 42 seconds
ZDM_GET_SRC_INFO ................ COMPLETED
ZDM_GET_TGT_INFO ................ COMPLETED
ZDM_PRECHECKS_SRC ............... COMPLETED
ZDM_PRECHECKS_TGT ............... COMPLETED
ZDM_SETUP_SRC ................... COMPLETED
ZDM_SETUP_TGT ................... COMPLETED
ZDM_PREUSERACTIONS .............. COMPLETED
ZDM_PREUSERACTIONS_TGT .......... COMPLETED
ZDM_VALIDATE_SRC ................ COMPLETED
ZDM_VALIDATE_TGT ................ COMPLETED
ZDM_DISCOVER_SRC ................ COMPLETED
ZDM_COPYFILES ................... COMPLETED
ZDM_PREPARE_TGT ................. COMPLETED
ZDM_SETUP_TDE_TGT ............... COMPLETED
ZDM_RESTORE_TGT ................. COMPLETED
ZDM_RECOVER_TGT ................. COMPLETED
ZDM_FINALIZE_TGT ................ COMPLETED
ZDM_CONFIGURE_DG_SRC ............ COMPLETED
ZDM_SWITCHOVER_SRC .............. COMPLETED
ZDM_SWITCHOVER_TGT .............. COMPLETED
ZDM_POST_DATABASE_OPEN_TGT ...... PENDING
ZDM_NONCDBTOPDB_PRECHECK ........ PENDING
ZDM_NONCDBTOPDB_CONVERSION ...... PENDING
ZDM_POST_MIGRATE_TGT ............ PENDING
TIMEZONE_UPGRADE_PREPARE_TGT .... PENDING
TIMEZONE_UPGRADE_TGT ............ PENDING
ZDM_POSTUSERACTIONS ............. PENDING
ZDM_POSTUSERACTIONS_TGT ......... PENDING
ZDM_CLEANUP_SRC ................. PENDING
ZDM_CLEANUP_TGT ................. PENDING

Pause After Phase: "ZDM_SWITCHOVER_TGT"
To wrap up
ZDM has got the flexibility to complete a phase manually and change ZDM metadata in order to move forward. This solution needs to be executed carefully. If you are not full confident, I would recommend you to open a SR. Of course, we can not use such method just to resolve a part of a phase. We will need to complete the phase manually until the end, executing manually all operations. Easy for a phase that is just running a switchover. It might be more complex for another phase.
L’article ZDM Physical Online Migration failing during ZDM_SWITCHOVER_SRC phase est apparu en premier sur dbi Blog.
Clone Oracle Database configured with Oracle Key Vault (OKV)
This post is to describe the process of cloning an Oracle Database which is configured to store the TDE (encryption keys) in the Oracle Key Vault (OKV)
If the source database is configured with Oracle key Vault, than we can clone the database withouth having to transport the key files on the destination server.
In this exemple the clone will be made on the same host.
To install the RESTFul API and add a database as endpoint to OKV check my previous BLOG Add Oracle database server to Oracle Key vault (OKV) from scratch, only with RESTfull API.
The initial configuration is :
- The source database name is
CDB01 - The target database name will be
CDB02 - The
wallet_rootdatabase parameter on source database,CDB01, is set to/opt/oracle/admin/CDB01/wallet - The
tde_configurationparameter on source database,CDB01, is set toKEYSTORE_CONFIGURATION=OKV|FILE. That means that the keystore is in OKV server and the auto login file is on local filesystem in/opt/oracle/admin/CDB01/wallet/tdepath. - The source database is enrolled as an endpoint. A wallet was defined for the
CDB01endpoint, and the TDE keys are uploaded in this wallet. - On
CDB01the SYS password is tagged as sys_pwd - The endpoint password is tagged as endpoint_pwd
- The RESTFul API is installed on the server in the path
$HOME/okv - Finally, the name of the wallet defined in OKV which contains the TDE keys for
CDB01database isORA_DB
The schema is something like this:
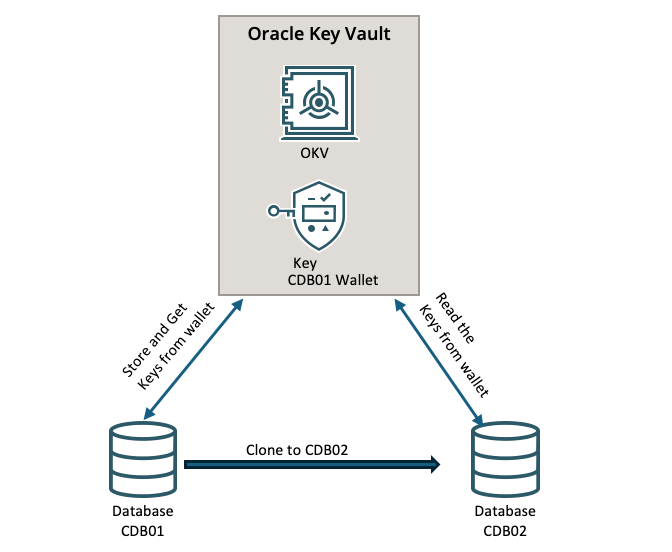
The CDB01 database store his keys in ORA_DB wallet. Normally it has the rights to read/write in this wallet. At enrol time, we are going to give the rights ro read the ORA_DB wallet to CDB02 endpoint (database).
I also use a simple sql script to check the wallet status at the database level:
[oracle@db ~]$ cat $HOME/tde.sql

set pages 200
set line 300
col WRL_PARAMETER format a50
col status forma a10
col pdb_name  format a20
select pdb_id, pdb_name, guid from dba_pdbs;
select * from v$encryption_wallet where con_id != 2;
The first step is the enrolment of the destination database, CDB02, and grant the rights to read the keys from OKV server.
Create the destination directory structure for CDB02.
[oracle@db ~]$ cat $HOME/okv/set_okv_rest_env.sh
export OKV_RESTCLI_CONFIG=$HOME/okv/conf
export JAVA_HOME=/usr/java/jdk-11.0.10
export OKV_HOME=$HOME/okv

# source the RESFul API environnement file
[oracle@db ~]$ source $HOME/okv/set_okv_rest_env.sh
Create the database endpoint, for CDB02, using a JSON parameter file:
# create the JSON file for endpoint creation
[oracle@db ~]$ cat 01.create_endpoint_CDB02.json
{
  "service" : {
    "category" : "admin",
    "resource" : "endpoint",
    "action" : "create",
    "options" : {
      "endpoint" : "DB_CDB02",
      "description" : "DB server CDB02",
      "platform" : "LINUX64",
      "type" : "ORACLE_DB",
      "strictIpCheck" : "FALSE"
    }
  }
}

# create the endpoint on OKV
[oracle@db ~]$ $OKV_HOME/bin/okv admin endpoint create --from-json 01.create_endpoint_CDB02.json
{
  "result" : "Success"
}
Enrol the CDB02 endpoint.
# create the enroll endpoint JSON file
[oracle@db ~]$ cat 02.provision_endpoint_CDB02.json
{
  "service" : {
    "category" : "admin",
    "resource" : "endpoint",
    "action" : "provision",
    "options" : {
      "endpoint" : "DB_CDB02",
      "location" : "/opt/oracle/admin/CDB02/wallet/okv",
      "autoLogin" : "FALSE"
    }
  }
}

# enroll the endopoint
[oracle@db ~]$ $OKV_HOME/bin/okv admin endpoint provision --from-json 02.provision_endpoint_CDB02.json
Enter Oracle Key Vault endpoint password: endpoint_pwd
{
  "result" : "Success"
}
Grant the access to the new CDB02 endpoint to read the wallet ORA_DB which keep the CDB01 TDE keys.
# create the grant access file to the wallet Keeping the source CDB01 Keys.
[oracle@db ~]$ cat 04_grant_access_wallet_CDB02.json
{
  "service" : {
    "category" : "manage-access",
    "resource" : "wallet",
    "action" : "add-access",
    "options" : {
      "wallet" : "ORA_DB",
      "endpoint" : "DB_CDB02",
      "access" : "RM_MW"
    }
  }
}

# grant the access to the ORA_DB wallet for the endpoint.
[oracle@db ~]$ $OKV_HOME/bin/okv manage-access wallet add-access --from-json 04_grant_access_wallet_CDB02.json
{
  "result" : "Success"
}
Check that CDB02 endpoint can read the keys from CDB01 wallet.
# Test
[oracle@db ~]$ /opt/oracle/admin/CDB02/wallet/okv/bin/okvutil list
Enter Oracle Key Vault endpoint password: endpoint_pwd
Enter Oracle Key Vault endpoint password:
Unique ID                               Type            Identifier
600D0743-01D9-4F2F-BF6F-C9E8AC74FF2A	Symmetric Key	TDE Master Encryption Key: TAG CDB:CDB01 MEK first
6A752388-F93D-4F14-BF35-39E674CAAFED	Symmetric Key	TDE Master Encryption Key: TAG REKEY CDB01
AB294686-1FC4-4FE8-BFAD-F56BAD0A124B	Symmetric Key	TDE Master Encryption Key: TAG REKEY CDB01
BB0CC77A-10AD-4F55-BF0A-9F5A4C7F98C1	Symmetric Key	TDE Master Encryption Key: TAG CDB:DBTDEOKV:PDB1 MEK first
At this level okvutil list for CDB02 endpoint, command return the keys available for CDB01 source database.
Create an temporary init file with the TDE OKV parameters.
[oracle@db ~]$ cat /tmp/init.ora
db_name='CDB02'
wallet_root='/opt/oracle/admin/CDB02/wallet'
tde_configuration='KEYSTORE_CONFIGURATION=OKV|FILE';
enable_pluggable_database=true
Copy the Oracle password file /opt/oracle/product/19c/dbhome_1/dbs/orapwdCDB01 to /opt/oracle/product/19c/dbhome_1/dbs/orapdwCDB02.
Add the CDB02 as static identifier to the listener.
[oracle@db ~]$ cat $ORACLE_HOME/network/admin/listener.ora
LISTENER = (ADDRESS_LIST= (ADDRESS=(PROTOCOL=tcp)(HOST=db.sub05191447261.vcn01.oraclevcn.com)(PORT=1521)))

SID_LIST_LISTENER=
(SID_LIST=
.....
    (SID_DESC=
        (GLOBAL_DBNAME=CDB02)
        (SID_NAME=CDB02)
        (ORACLE_HOME=/opt/oracle/product/19c/dbhome_1)
    )
)

# restart the listener
[oracle@db ~]$ lsnrctl start listener
.....
Services Summary...
Service "CDB01" has 1 instance(s).
  Instance "CDB01", status UNKNOWN, has 1 handler(s) for this service...
Service "CDB02" has 1 instance(s).
  Instance "CDB02", status UNKNOWN, has 1 handler(s) for this service...
The command completed successfully
Set the CDB02 environnement and start the database using the temporary init file.
[oracle@db ~]$ . oraenv <<< CDB02

[oracle@db ~]$ sqlplus / as sysdba
SQL> startup nomount pfile='/tmp/init.ora'
SQL> exit;

[oracle@db ~]$ rman target sys/sys_pwd@CDB01 auxiliary sys/sys_pwd@CDB02

connected to target database: CDB01 (DBID=1690718290)
connected to auxiliary database: CDB02 (not mounted)

RMAN> run {
  allocate auxiliary channel aux1 device type disk;
  allocate auxiliary channel aux2 device type disk;

  duplicate target database to CDB02 from active database
  SPFILE
  PARAMETER_VALUE_CONVERT 'CDB01' 'CDB02'
  NOFILENAMECHECK;
}

using target database control file instead of recovery catalog
allocated channel: aux1
channel aux1: SID=180 device type=DISK

allocated channel: aux2
channel aux2: SID=21 device type=DISK

Starting Duplicate Db at 26-MAR-24
current log archived

contents of Memory Script:
{
   restore clone from service  'CDB01' spfile to
 '/opt/oracle/product/19c/dbhome_1/dbs/spfileCDB02.ora';
   sql clone "alter system set spfile= ''/opt/oracle/product/19c/dbhome_1/dbs/spfileCDB02.ora''";
}
.....
contents of Memory Script:
{
   Alter clone database open resetlogs;
}
executing Memory Script

database opened

contents of Memory Script:
{
   sql clone "alter pluggable database all open";
}
executing Memory Script

sql statement: alter pluggable database all open
Finished Duplicate Db at 26-MAR-24
The clone is finished. Test the WALLET configuration
[oracle@db ~]$ . oraenv <<< CDB02

[oracle@db ~]$ sqlplus / as sysdba

SQL> @$HOME/tde

    PDB_ID PDB_NAME		GUID
---------- -------------------- --------------------------------
	 3 PDB01		0AE3AEC4EE5ACDB1E063A001A8ACB8BB
	 2 PDB$SEED		0AE38C7FF01EC651E063A001A8AC821E


WRL_TYPE  WRL_PARAMETER                         STATUS         WALLET_TYPE  WALLET_OR KEYSTORE FULLY_BAC CON_ID
--------- ------------------------------------- -------------- ------------ --------- -------- --------- ----------
FILE      /opt/oracle/admin/CDB02/wallet/tde/   NOT_AVAILABLE  UNKNOWN        SINGLE   NONE     UNDEFINED    1
OKV                                             CLOSED         UNKNOWN        SINGLE   NONE     UNDEFINED    1
FILE                                            NOT_AVAILABLE  UNKNOWN        SINGLE   UNITED   UNDEFINED    3
OKV                                             CLOSED         UNKNOWN        SINGLE   UNITED   UNDEFINED    3

-- the wallet is closed. Open it:

SQL> administer key management set keystore open identified by "endpoint_pwd" container=all;

keystore altered.

SQL> @$HOME/tde

    PDB_ID PDB_NAME		GUID
---------- -------------------- --------------------------------
	 3 PDB01		0AE3AEC4EE5ACDB1E063A001A8ACB8BB
	 2 PDB$SEED		0AE38C7FF01EC651E063A001A8AC821E


WRL_TYPE  WRL_PARAMETER                        STATUS       WALLET_TYPE  WALLET_OR KEYSTORE FULLY_BAC  CON_ID
--------- ------------------------------------ ---------- -------------- --------- -------- --------- ----------
FILE      /opt/oracle/admin/CDB02/wallet/tde/  OPEN_NO_MA    AUTOLOGIN    SINGLE    NONE    UNDEFINED    1
                                               STER_KEY
OKV                                            OPEN          OKV          SINGLE    NONE    UNDEFINED    1
FILE                                           OPEN_NO_MA    AUTOLOGIN    SINGLE    UNITED  UNDEFINED    3
                                               STER_KEY
OKV                                            OPEN          OKV          SINGLE    UNITED  UNDEFINED    3
Finally create the auto login wallet, and restart the cloned database to validate the configuration.
[oracle@db ~]$ . oraenv <<< CDB02

[oracle@db ~]$ sqlplus / as sysdba
-- "OKV_PASSWORD" is used to open the wallet.
-- "HSM_PASSWORD" is used to access the OKV server(s).
SQL> ADMINISTER KEY MANAGEMENT ADD SECRET 'endpoint_pwd' FOR CLIENT 'HSM_PASSWORD' TO AUTO_LOGIN KEYSTORE '/opt/oracle/admin/CDB02/wallet/tde';

-- check that the autologin wallet was created
SQL> !ls /opt/oracle/admin/CDB02/wallet/tde
cwallet.sso

SQL> startup force

SQL> show pdbs

    CON_ID CON_NAME			  OPEN MODE  RESTRICTED
---------- ------------------------------ ---------- ----------
	 2 PDB$SEED			  READ ONLY  NO
	 3 PDB01			  MOUNTED

SQL> alter pluggable database PDB01 open;

Pluggable database altered.

SQL> @$HOME/tde

    PDB_ID PDB_NAME		GUID
---------- -------------------- --------------------------------
	 3 PDB01		0AE3AEC4EE5ACDB1E063A001A8ACB8BB
	 2 PDB$SEED		0AE38C7FF01EC651E063A001A8AC821E


WRL_TYPE  WRL_PARAMETER                        STATUS       WALLET_TYPE  WALLET_OR KEYSTORE FULLY_BAC  CON_ID
--------- ------------------------------------ ---------- -------------- --------- -------- --------- ----------
FILE      /opt/oracle/admin/CDB02/wallet/tde/  OPEN_NO_MA    AUTOLOGIN    SINGLE    NONE    UNDEFINED    1
                                               STER_KEY
OKV                                            OPEN          OKV          SINGLE    NONE    UNDEFINED    1
FILE                                           OPEN_NO_MA    AUTOLOGIN    SINGLE    UNITED  UNDEFINED    3
                                               STER_KEY
OKV                                            OPEN          OKV          SINGLE    UNITED  UNDEFINED    3
All PDB are correctly opened and the wallet are opened too.
ConclusionThe clone process can be fully automatised, and no wallet file must be transfered between the source and the destination server. With the keys in OKV the clone process is identically as withouth OKV. Keeping the keys in OKV is more secure as the principle “Zero touch keys” is respected, and DBA do not manipulate the keys.
Finally if we want to configure the database CDB02 to use another keys as the keys from CDB01, we can execute a REKEY operation.
L’article Clone Oracle Database configured with Oracle Key Vault (OKV) est apparu en premier sur dbi Blog.
Cloud Native Storage: Identify your storage

Welcome back in this series of blogs regarding Cloud Native Storage. Check my previous on Cloud Native Storage: Overview for the introduction.
In this one, I will discuss about the process involved in choosing a cloud native storage product. If you remember my previous blog, I pasted the exhaustive (big!) list of products. Of course, if you are familiar with Kubernetes you’ll probably know that we can create multiple storage classes, and you are right. The point here is more about choosing a product that will fit a specific workload.
Workload can be of several kinds.
- Databases
- Stateless/stateful application
- Monitoring stack
- Web applications
- Big datatest
- Microservices architectures
- e-commerce
- Healthcare sensitive data
- Machine learning
It’s mandatory to know what are the constraints when thinking about your workload. Let’s try to list some of them and determine which ones are relevant to your use case
- Reliability and durability
- Scalability
- Performance
- Security
- Cloud/On premise
- Storage type (S3, nvme, …)
- Cost
- Lifecycle management
- Observability
- Ease of use
- Vendor support
- Popularity
There is so much to say regarding each constraints, that’s why I mentioned to do a short list of main constraints and secondly to weight them. This will help you focus on essential expectations. Let’s take an example with cost. You may remember that products with a white background are open source, it not only means the product is free to use but also that you’ll be able to compare different products and why not also compare a proprietary product with trials that are often offered.
We can also take the performance constraint. This one is essential with relational databases workload. If it’s your case and you’re new with the topic, you’ve probably chosen the local PV storage to maximize latency and throughput, but with more experience you’ll find that products like
- Portworx that allows you to control IOPS or throughput at the storage layer here.
- Linbit that has impressive IOPS performance here
Another constraint example I would like to talk about is popularity. Most of the products should be either supported by vendor or adopted by majority of the community so it guarantees you (a certain degree) of confidence to use it. My opinion reflect of course a “majority adopter” posture. In case your posture is “early”, it means you probably contribute to open source, then I just want to say “Thank you!” and keep going. I hope I will also be able to contribute in a near future. In case your posture is “laggards”, then continue your analysis with PoC to gain confidence.
You’ll find below the Innovation model lifecycle from Wikipedia.
All kinds of adopters have their pros and cons and contribute to the community by giving feedbacks from their usage.
This brings me to the next point I wanted to mention in this blog. How can we discuss with contributors, users and vendor.
Let’s take the easy point with vendor. If you have something to discuss (issue, remarks, usage, feedback) the official vendor communication channels (e-mail, slack, sales, ticket, etc …) will be the best.
Now, regarding open-source products, there are severals way to discuss points, you have official vendor communication channels (e-mail, slack, sales, ticket, etc …) and also what you can find from people usage (stackoverflow, reddit, …).
Of course, said like that open-source has more possibility to get you answer. But the main difference is SLA with a product you paid for, vendor will have to give you an answer in a defined timeframe regarding the priority given to your ticket.
All discussed points brings us to the final words that
- There is no silver bullet solution
- You have to know and weight your constraints
- You need to know where you stand regarding adoption
We, at dbi services, can provide support to help you choose and also accompany you on your journey to understand the CNCF. Don’t hesitate to post comments or contact our sales team for support.
In the next blog, I’ll go deeper with a concrete example of a database workload that will leverage on a cloud native storage.
L’article Cloud Native Storage: Identify your storage est apparu en premier sur dbi Blog.
Add a UI to explore the Feathers.js API
Following on from my previous article: Create REST API from your database in minute with Feathers.js, today I want to add a UI to explore the Feathers.js API.
When we provide an API, it’s common to make a tool available to explore the exposed methods.
Swagger UI is one such tool, and fortunately, in the Feathers.js ecosystem, a package is available for this purpose.
In my previous article, I created a Feathers.js project using Koa as HTTP framework, TypeScript as language and NPM as package manager. To install the feathers-swagger package, I use the command :
npm install feathers-swagger swagger-ui-dist koa-mount koa-staticOnce I’ve installed the necessary packages, I just need to declare the Swagger interface in my project.
At the beginning of the src/app.ts file, I add the swagger package import:
import swagger from 'feathers-swagger';
Then, before the “app.configure(services)”, I add the Swagger declaration:
app.configure(swagger({
  specs: {
    info: {
      title: 'Workshop API ',
      description: 'Workshop API rest services',
      version: '1.0.0',
    }
  },
  ui: swagger.swaggerUI({ docsPath: '/docs' }),
}))
Note: the position of the declaration in the file is very important: if it’s after the services configuration, the Swagger interface will be empty.
Second step: expose the service in Swagger UIOnce the feathers-swagger package has been installed and initialized in the project, all I have to do is tell the services what to expose. To do this, I add a docs part to my service workshop service in the file (src/services/workshop/workshop.ts).
// A configure function that registers the service and its hooks via `app.configure`
export const workshop = (app: Application) => {
  // Register our service on the Feathers application
  app.use(workshopPath, new WorkshopService(getOptions(app)), {
    // A list of all methods this service exposes externally
    methods: workshopMethods,
    // You can add additional custom events to be sent to clients here
    events: [],
    docs: createSwaggerServiceOptions({
      schemas: { workshopSchema, workshopDataSchema, workshopPatchSchema, workshopQuerySchema },
      docs: {
          // any options for service.docs can be added here
          description: 'Workshop service',
      }
    }),
  })
Don’t forget to add the necessary imports at the beginning of the file:
import {
  workshopDataValidator,
  workshopPatchValidator,
  workshopQueryValidator,
  workshopResolver,
  workshopExternalResolver,
  workshopDataResolver,
  workshopPatchResolver,
  workshopQueryResolver,
  workshopDataSchema,
  workshopPatchSchema,
  workshopQuerySchema,
  workshopSchema
} from './workshop.schema'

import type { Application } from '../../declarations'
import { WorkshopService, getOptions } from './workshop.class'
import { workshopPath, workshopMethods } from './workshop.shared'
import { createSwaggerServiceOptions } from 'feathers-swagger'
Important : in the case of a TypeScript project, the docs property is not recognized. An additional type declaration must therefore be added. In the src/declarations.ts file, add :
declare module '@feathersjs/feathers' {
  interface ServiceOptions {
    docs?: ServiceSwaggerOptions;
  }
}As usual, to test the service, I use the command :
npm run devOnce the server has been started, simply access the docs page: http://localhost:3030/docs/
From the Swagger interface, I can test API methods:
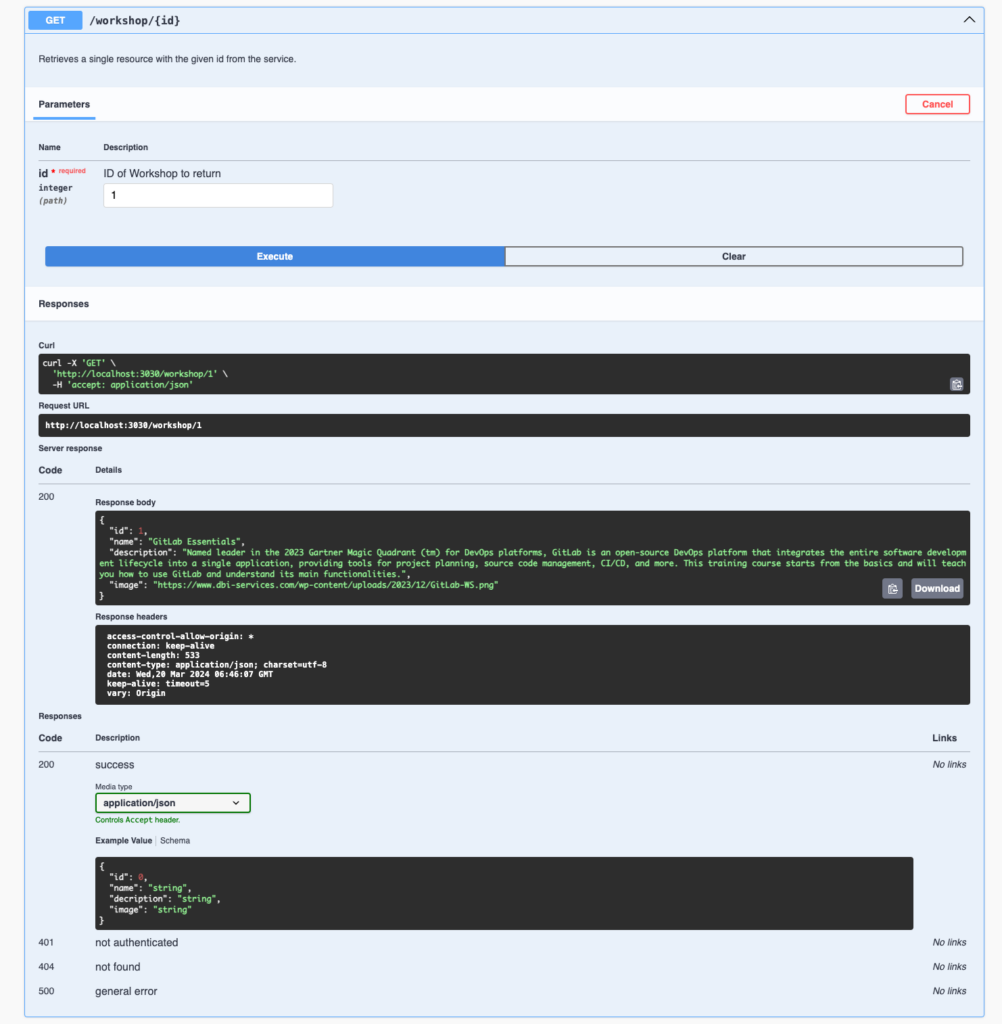 Conclusion
Adding a UI to explore the Feathers.js API is quick and easy, thanks to our ecosystem packages.
Swagger UI is a very useful tool, and adding it to your project is a good idea in many cases, such as :
- When developing the API itself, to test methods and make sure they work properly
- For the front-end developer using the API, it’s easy to know which methods are available and how to use them.
- In the case of a public API, users can easily support and test methods using the UI
L’article Add a UI to explore the Feathers.js API est apparu en premier sur dbi Blog.
Containers Security – Protect Against SSN Exfiltration with NeuVector
You may have heard a few weeks ago, in France, more than 30 millions Security Social Numbers (SSN) have been stolen. These data have been exfiltrated from databases. In these modern days, you are probably running your website in a container and use Kubernetes for its autoscaling capabilities. You then need to take care of containers security.
A common method to exfiltrate data is to use a Command and Control (C&C also known as C2) attack. It existed before containerization but its principle is still the same. It is about infecting a machine with a malware. An external attacker can then leverage this malware to send command to and receive data from this compromised machine. As a Kubernetes Administrator you have to be able to thwart such attacks and tackle containers security. Let’s find out how in this blog post!
NeuVector observability for containers securityOften C2 tools are used by what we call script kiddies. They have no deep knowledge in security and are just messing around with tools when an opportunity arises. They could use a basic C2 tool to exfiltrate data without being encrypted. This is plain HTTP and with a L7-aware tool you would be able to see these data flowing out. However, by default Kubernetes doesn’t have such observability capacity and what you would see in your network is shown below:
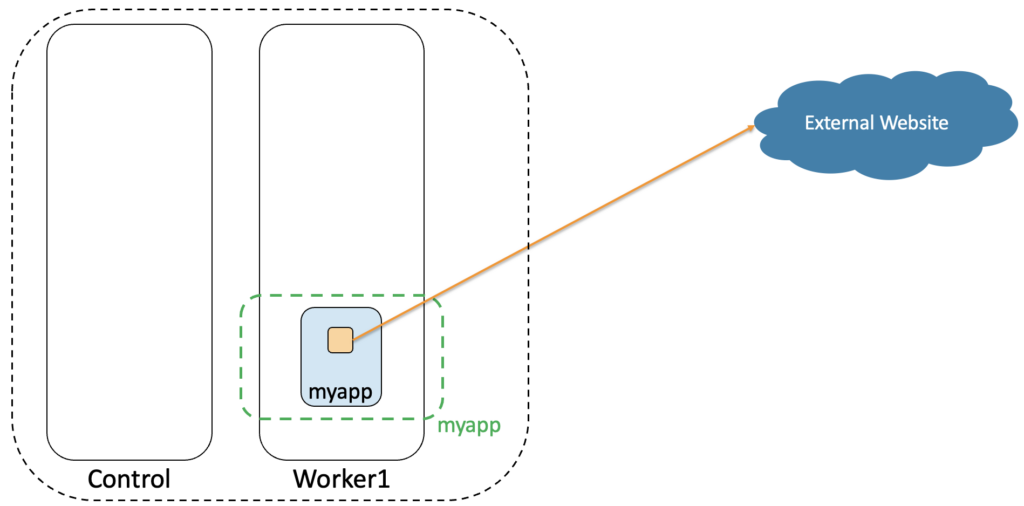
Exactly, you would see nothing! Our orange container in our blue pod myapp (in the green namespace myapp) doesn’t trigger any specific alarm in our Kubernetes cluster. All seems normal whereas this container has been compromised. It exfiltrates data to an external website that is under the control of an attacker.
To be able to detect such exfiltration we will install the application NeuVector from SUSE. It is very easy to install through an operator or with Helm. In a previous blog post, I’ve described how to install it in OpenShift. NeuVector is a Swiss Army knife for security in Kubernetes. It provides numerous features to protect your Kubernetes cluster and improve your overall containers security. Here we will use NeuVector capability to observe data in L7 (here HTTP) of a packet.
Data Loss Prevention (DLP) in NeuVectorFor this L7 observability to operate, we need to configure it in NeuVector. Let’s see how to do that. In NeuVector you can configure DLP sensors. A sensor is just a regex filter to will detect a patters in the L7 of each packet. By default there is a sensor for the American Social Security Number (SSN) and the Credit Card in various formats (visa, master, american express,…). A DLP sensor for the french SSN doesn’t exist so we first need to create it as shown below:

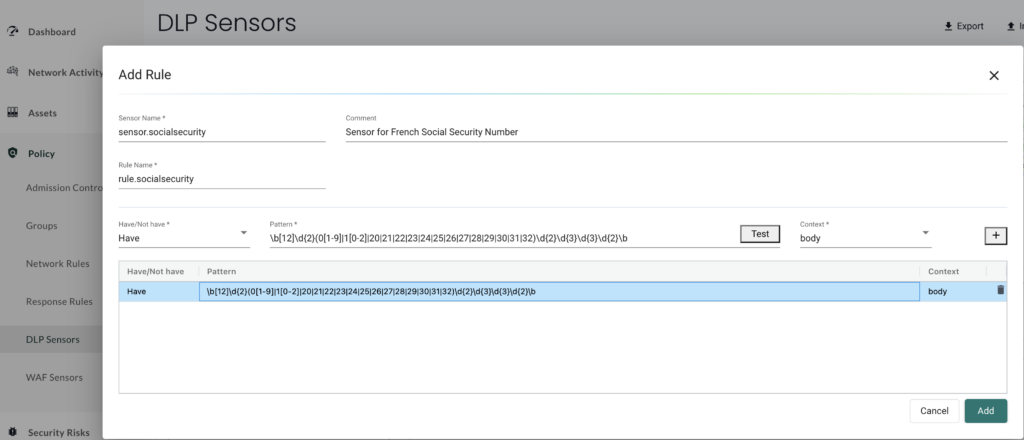
We give a name to our sensor and define the regex pattern that will find a french SSN in any packet. This SSN format is detailed here in French. The regex pattern used is the one below:
\b[12]\d{2}(0[1-9]|1[0-2]|20|21|22|23|24|25|26|27|28|29|30|31|32)\d{2}\d{3}\d{3}\d{2}\b
With this sensor created, we can now apply it to our pod as shown below:

We select our container in our pod and add a DLP Policy to use the sensor we have just created:
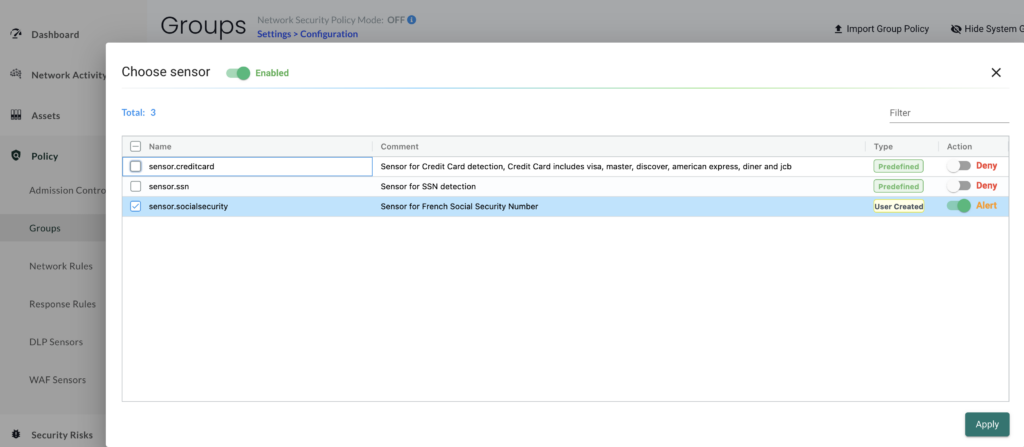
We apply our sensor to detect any french SSN and set the action to Alert to just log any match found.
Data exfiltration detectionWith NeuVector and this DLP in place, we have added L7 observability in our Kubernetes cluster and can now see the following regarding our pod myapp:
Yes! We can now detect a french SSN being exfiltrated from our Kubernetes cluster.
In NeuVector, we can use the graphical “Network Activity” view to observe the traffic in our cluster and we would see the following:

There is a traffic from myapp to the external world and this link is orange. If we click on it, we can see our DLP sensor has detected some traffic that matches our regex filter. We can also see that alert in the security events as shown below:

We can see the action is Alert as this is what we have configured. At this stage the traffic is not blocked so our data are still being exfiltrated but at least it is logged.
RemediationLet’s now see how we could stop these data from being exfiltrated. We will switch the DLP sensor action to “Deny” and switch the pod in “Protect” mode to block that traffic:

We can now see the deny action below in our security event:
 Wrap up
We have seen how NeuVector can provide L7 visibility in your Kubernetes cluster. It can detect a pattern in HTTP packets such as a french SSN, log it and block it. We could also use this method to detect legit applications that would send data unencrypted. This would be a good way to improve your containers security by forcing the use of encryption with HTTPS. In case the data are exfiltrating by using HTTPS we could not use this DLP sensor method but would need to apply a different security strategy.
L’article Containers Security – Protect Against SSN Exfiltration with NeuVector est apparu en premier sur dbi Blog.


